Figure 5.
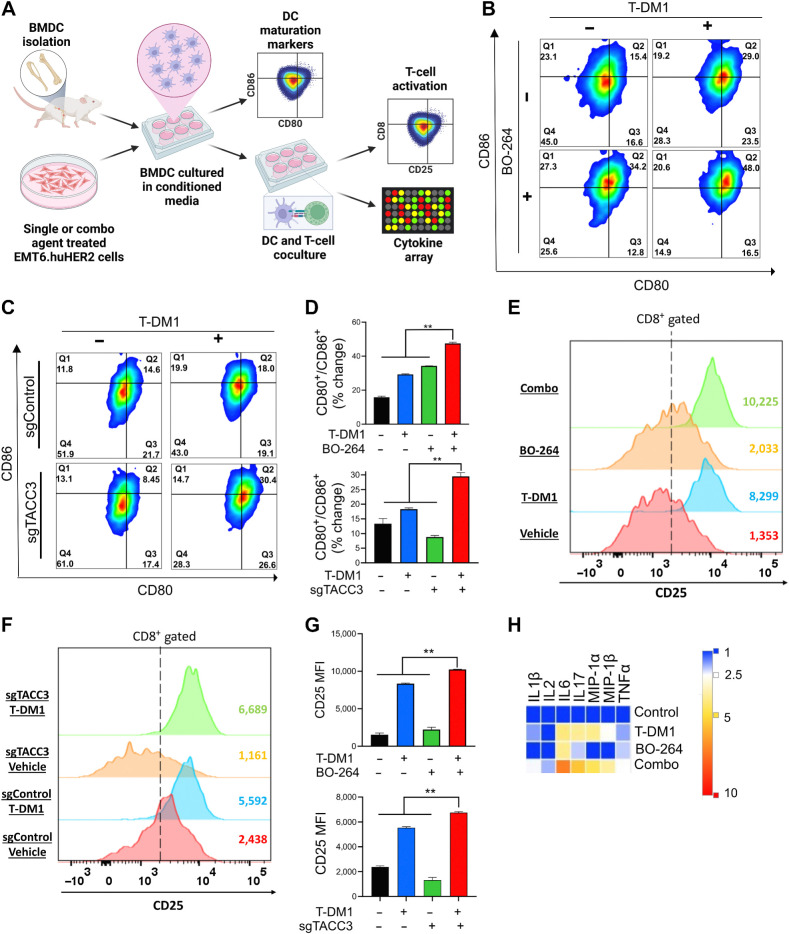
Inhibition of TACC3 in combination with T-DM1 leads to ex vivo DC maturation, T-cell activation, and release of ICD-related proinflammatory cytokines. A, Schematic representation of the experimental workflow for DC maturation, T-cell activation, and cytokine profiling experiments. B and C, Flow cytometry analysis of DC maturation markers in DC cells incubated with the CM collected from EMT6.huHER2 cells treated with 7.5 μg/mL T-DM1 and 500 nmol/L BO-264, alone or in combination (B) or in EMT6.huHER2.sgControl vs. sgTACC3 cells treated with 7.5 μg/mL T-DM1 (C). D, Quantification of CD80+/CD86+ cells from B and C (n = 2). E and F, Flow cytometry analysis of T-cell activation marker, CD25 in CD8+ T cells cocultured with DCs from B and C. G, Quantification of the CD25 mean fluorescence intensity (MFI) from E and F (n = 2). H, Levels of proinflammatory cytokines in the media collected from DC-T-cell cocultures from E. Data correspond to mean values ± SD. P values were calculated with the unpaired, two-tailed Student t test. **, P < 0.01. (A, Created with BioRender.com.)

