. 2024 Feb 12;22(5):452–464. doi: 10.1158/1541-7786.MCR-23-0976

Figure 1.

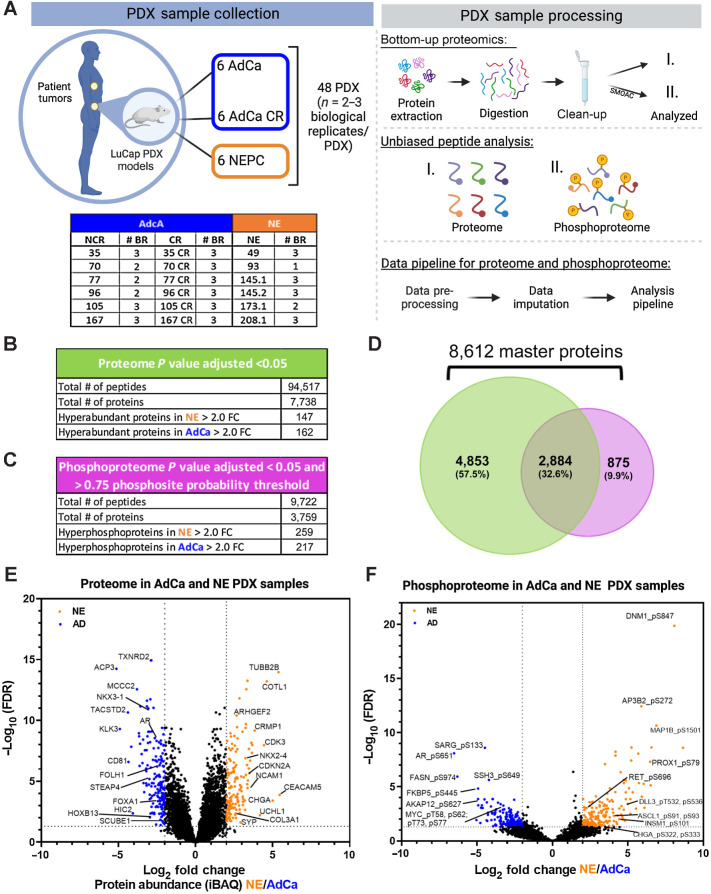
Figure 1. Proteomic and phosphoproteomic platform and characterization. A, The LuCaP series of 48 PDX tumors is depicted in the table, where 33 AdCa either castrated and noncastrated tumors are shown in dark blue and 15 NEPC tumors are shown in orange, n = 2–3 biological replicates (BR). The PDXs were processed by extracting proteins and an enzymatic digestion was performed using Trypsin and LysC. Peptides were purified by reversed-phase chromatography. The final peptide pool was run as the proteome (I) and in parallel a SMOAC assay was performed to enrich for phosphorylated serine, threonine and tyrosine which was run as the phosphoproteome (II). Finally, raw data were searched, processed, and analyzed. B, Overall proteome results using 1% FDR for protein identification and P value adjusted < 0.05 log2 fold change (FC) significance. C, Overall proteome results using 1% FDR for phosphoprotein identification and P value adjusted <0.05 log2 fold change (FC) significance and >0.75 phosphosite probability threshold. D, Venn diagram of the proteome and phosphoproteome shows the total number of 8,612 master proteins identified when both data sets are overlaid. E, Volcano plot of the proteome depicting the intensity-based average quantification (iBAQ) enriched in NE and AdCa. F, Volcano plot of the phosphoprotein enriched in NE vs. AdCa. Gray lines in the x-axis and y-axis are the cutoff threshold for NE 2-fold change and for AdCa 2-fold change and P value adjusted to (−log10 FDR), respectively in E–F.

Proteomic and phosphoproteomic platform and characterization. A, The LuCaP series of 48 PDX tumors is depicted in the table, where 33 AdCa either castrated and noncastrated tumors are shown in dark blue and 15 NEPC tumors are shown in orange, n = 2–3 biological replicates (BR). The PDXs were processed by extracting proteins and an enzymatic digestion was performed using Trypsin and LysC. Peptides were purified by reversed-phase chromatography. The final peptide pool was run as the proteome (I) and in parallel a SMOAC assay was performed to enrich for phosphorylated serine, threonine and tyrosine which was run as the phosphoproteome (II). Finally, raw data were searched, processed, and analyzed. B, Overall proteome results using 1% FDR for protein identification and P value adjusted < 0.05 log2 fold change (FC) significance. C, Overall proteome results using 1% FDR for phosphoprotein identification and P value adjusted <0.05 log2 fold change (FC) significance and >0.75 phosphosite probability threshold. D, Venn diagram of the proteome and phosphoproteome shows the total number of 8,612 master proteins identified when both data sets are overlaid. E, Volcano plot of the proteome depicting the intensity-based average quantification (iBAQ) enriched in NE and AdCa. F, Volcano plot of the phosphoprotein enriched in NE vs. AdCa. Gray lines in the x-axis and y-axis are the cutoff threshold for NE 2-fold change and for AdCa 2-fold change and P value adjusted to (−log10 FDR), respectively in E–F.