Figure 2.
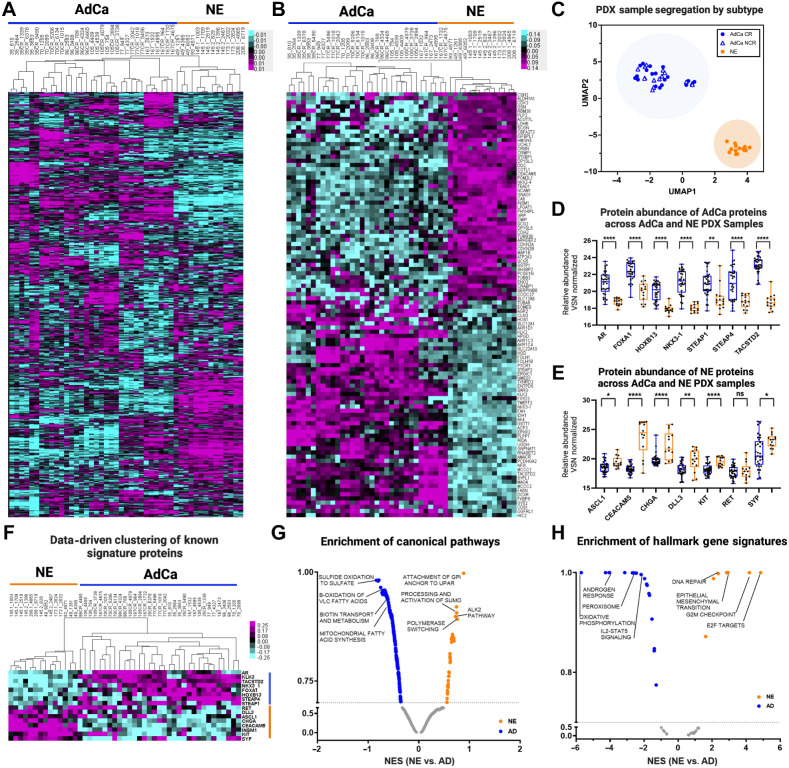
Proteome landscape of PDXs in prostate cancer. A, Unsupervised clustering data drive 7,738 master proteins 1% FDR. B, Unsupervised clustering of the top 50 NE and 50 AdCA proteins. C, UMAP analysis of all PDXs from the proteome. D, The relative abundance of AdCa signature proteins and E, NE signature proteins. Blue, AdCa PDX tumors; orange, NE PDX tumors. F, Data-driven supervised hierarchical clustering of NE and AdCa signature proteins. G, Pathway analysis of NE and AdCa highlighting four of the top pathways on each group. H, Hallmarks in cancer analysis of NE and AdCa highlighting four of the top pathways on each group (FDR 0.25).

