. 2024 Feb 12;22(5):452–464. doi: 10.1158/1541-7786.MCR-23-0976

Figure 3.

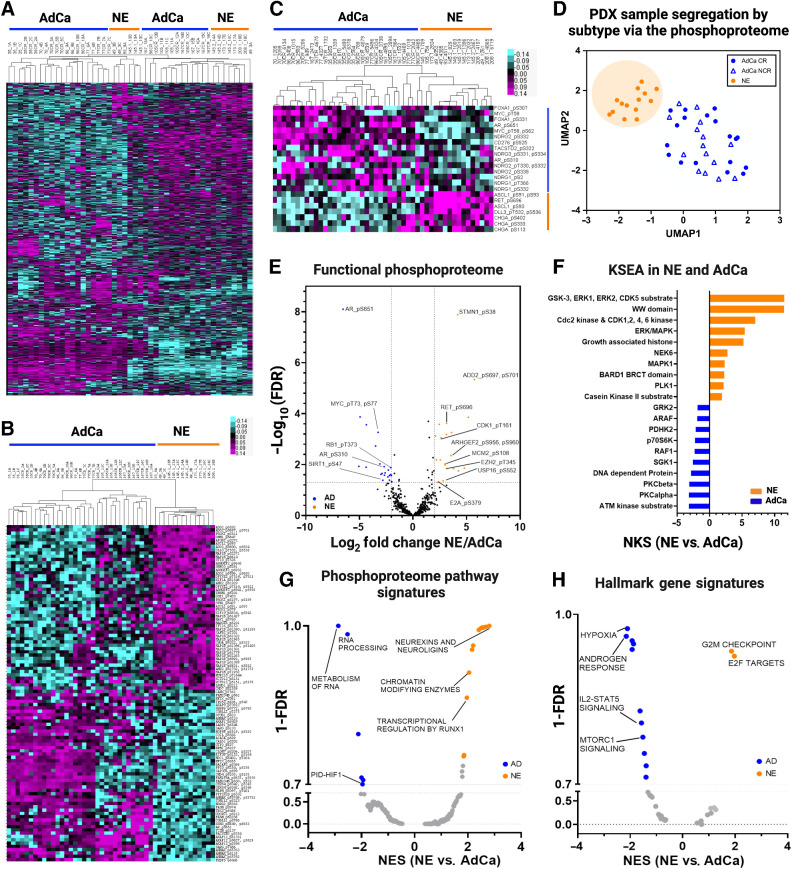
Figure 3. Phosphoproteome landscape of PDXs in prostate cancer. A, Data-driven unsupervised clustering of 9,723 phosphopeptides with 1% FDR. B, Unsupervised clustering of top 50 NE and 50 AdCA hyper-phosphorylated peptides. C, Unsupervised hierarchical clustering of AdCa and NE signature phosphoproteins. D, UMAP analysis of all phosphopeptides. E, Volcano plot of functional phosphoproteome of NE and AD hyperphosphorylated peptides. F, Kinase/substrate enrichment (KSEA) analysis identified unique and known kinases that were predicted from the phosphoproteome (top 10 hits are shown on each group). G–H, GSEA was performed to identify canonical pathways (F) and hallmarks in cancer (G) enriched in NE (orange) and AdCa (blue). NES, normalized enrichment score; orange, hyperphosphorylated in NE, and blue hyperphosphorylated in AdCa.

Phosphoproteome landscape of PDXs in prostate cancer. A, Data-driven unsupervised clustering of 9,723 phosphopeptides with 1% FDR. B, Unsupervised clustering of top 50 NE and 50 AdCA hyper-phosphorylated peptides. C, Unsupervised hierarchical clustering of AdCa and NE signature phosphoproteins. D, UMAP analysis of all phosphopeptides. E, Volcano plot of functional phosphoproteome of NE and AD hyperphosphorylated peptides. F, Kinase/substrate enrichment (KSEA) analysis identified unique and known kinases that were predicted from the phosphoproteome (top 10 hits are shown on each group). G–H, GSEA was performed to identify canonical pathways (F) and hallmarks in cancer (G) enriched in NE (orange) and AdCa (blue). NES, normalized enrichment score; orange, hyperphosphorylated in NE, and blue hyperphosphorylated in AdCa.