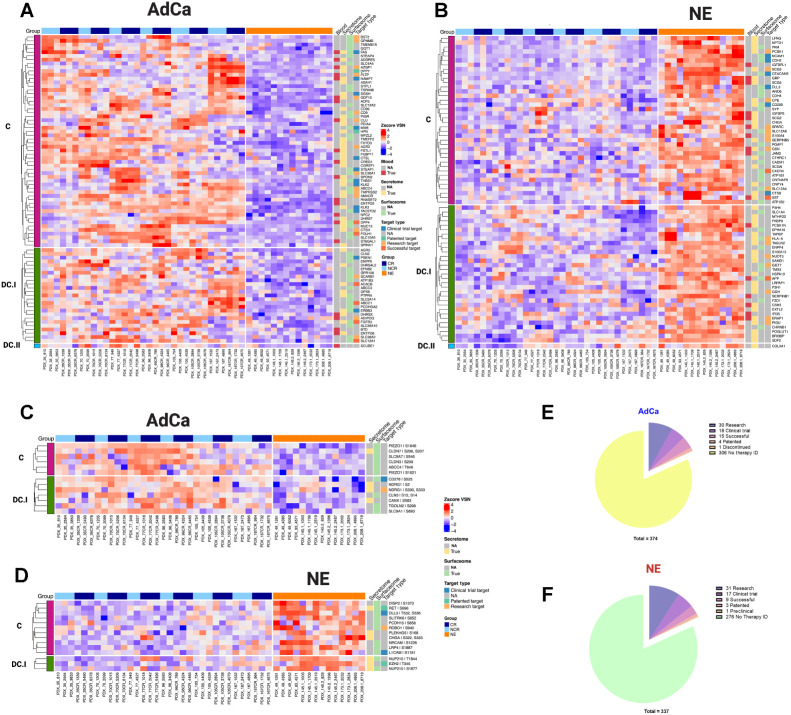
Figure 5.
Functional proteome and phosphoproteome characterization. Heat map data illustrate z-score VSN-normalized protein hyper-abundance expression for AdCa (n = 82; A) and NE (n = 70; B) Heat map data illustrates z-score VSN normalized proteins hyper-phosphorylated expression for AdCa (n = 13; C) and NE (n = 14; D). Concordance level was defined by using the master protein counterpart and clustered based on this concordance from the proteome. Pie charts illustrate the therapeutic target distribution identified across the hyper-abundant proteins in AdCa (E) with a total of 337 and NE (F) with a total of 374 analyzed. Functional proteins color coding that are identified as blood (red), secreted (yellow) surface (light green), and therapy target type such as clinical trial in blue, patented in green, research target in light orange, successful in terracotta, and no available data identified as NA in gray.

