. 2024 Feb 12;23(5):733–742. doi: 10.1158/1535-7163.MCT-23-0459

Figure 5.

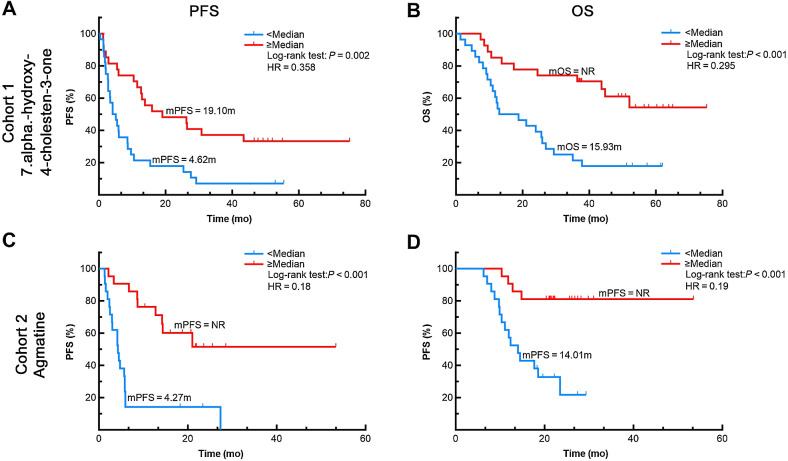
Figure 5. Representative images of Univariate Cox analysis of progression-free survival (PFS) or overall survival (OS) by the levels of metabolics in Cohorts 1and 2. A, PFS and (B) OS curves for patients with 7.alpha. -hydroxy-4-cholesten-3-one expression level ≥ median and < median in Cohort 1. C, PFS and (D) OS curves for patients with Agmatine expression level ≥ median and < median in Cohort 2.

Representative images of Univariate Cox analysis of progression-free survival (PFS) or overall survival (OS) by the levels of metabolics in Cohorts 1and 2. A, PFS and (B) OS curves for patients with 7.alpha. -hydroxy-4-cholesten-3-one expression level ≥ median and < median in Cohort 1. C, PFS and (D) OS curves for patients with Agmatine expression level ≥ median and < median in Cohort 2.