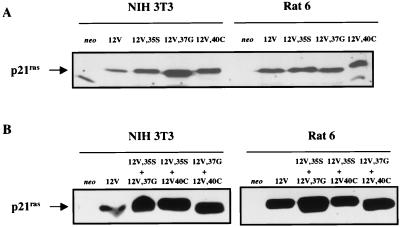
FIG. 1.
Expression of H-Ras 12V and effector loop mutant proteins in NIH 3T3 and Rat 6 cells. (A) NIH 3T3 and Rat 6 cells were stably transfected with expression vectors for the indicated proteins. The identity of the more rapidly migrating band of variable intensity is unknown, but it is not endogenous Ras. (B) NIH 3T3 and Rat 6 cells were transfected with combinations of expression vectors for the indicated proteins. Cell extracts (100 μg) were analyzed by SDS-polyacrylamide gel electrophoresis and immunoblotting with anti-Ras antibodies. The higher signal strength of immunoreactive Ras proteins in panel B than in panel A is due to a longer film exposure in panel B. Quantitation of the respective Ras proteins by densitometry gave the following ratios (in parentheses): for NIH 3T3 cells, 12V (1.0), 12V,35S (2.0), 12V,37G (3.2), 12V,40C (2.1), 12V,35S plus 12V,37G (1.5), 12V,35S plus 12V,40C (2.0), 12V,37G plus 12V,40C (1.6); for Rat 6 cells, 12V (1.0), 12V,35S (1.0), 12V,37G (0.7), 12V,40C (1.0), 12V,35S plus 12V,37G (1.9), 12V,35S plus 12V,40C (1.1), 12V,37G plus 12V,40C (1.5). Note that the same 12V-expressing cells and the same amounts of extract were used for panels A and B.

