Figure 1.
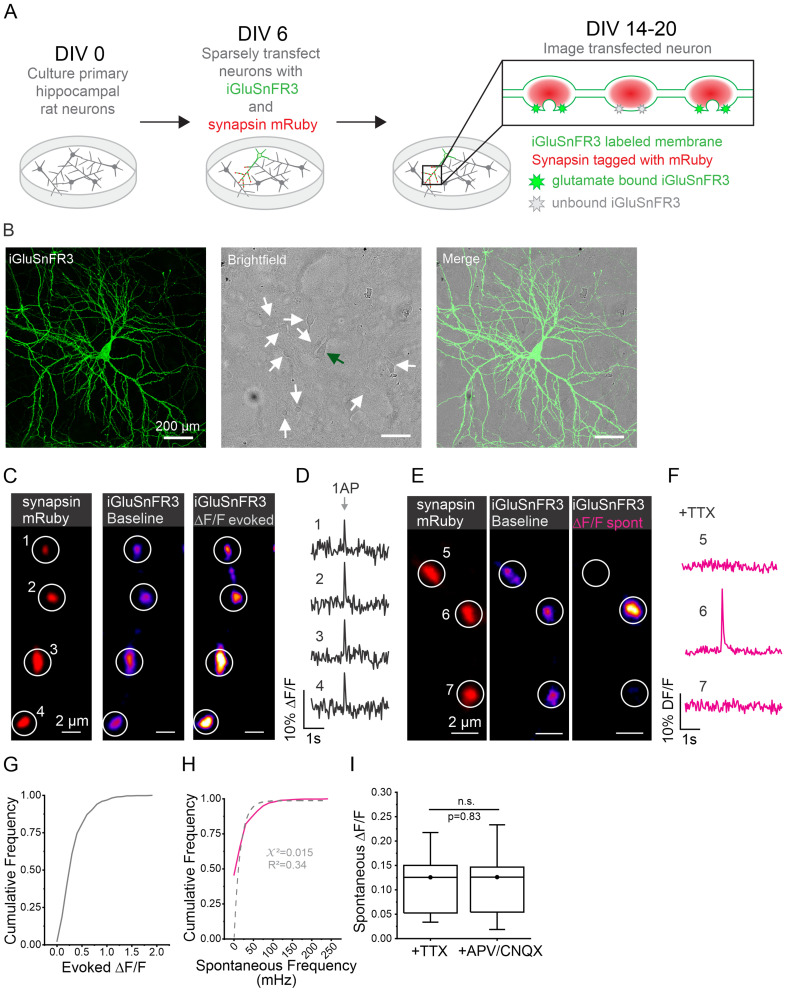
Evoked and spontaneous release events can be accurately detected and measured using iGluSnFR3. A, Experimental protocol. On DIV 0, primary hippocampal neurons are harvested from newborn rat pups. On DIV 6, neurons are transfected with iGluSnFR3 and synapsin-mRuby plasmids. Imaging experiments are performed DIV 14–20 when neurons are expressing previously transfected plasmids. When glutamate is bound to iGluSnFR3, the indicator increases in fluorescence. B, Representative images of sparsely transfected cell culture. The first panel shows fluorescent signal from iGluSnFR3-transfected cell fixed and tagged with GFP (see Methods). The second panel shows field of view through bright field with a green arrow indicating the cell body of transfected cell shown in the first panel and white arrows indicating surrounding cell bodies that have not been transfected. The third panel shows merging fluorescent and bright-field images. Note en passant boutons along axons. C, Imaging evoked release events at individual boutons. mRuby-labeled synapsin is used to identify ROIs (1–4), and iGluSnFR3 signal is shown for axons at rest as well as the change in fluorescence exhibited during stimulation with a single AP shown as DF/F used to detect release events. D, Corresponding traces for ROIs shown in C. DF/F traces showing evoked release events at individual boutons. E, Imaging spontaneous release events at individual boutons. ROIs (5–7) are determined using synapsin-mRuby signal (same method as for evoked release shown in panel C); iGluSnFR3 signal is measured only at boutons where spontaneous release event is occurring. F, Corresponding traces for ROIs shown in E. DF/F traces showing spontaneous release event are detected only at a single bouton (ROI 6) and not at adjacent boutons. G, Cumulative frequency of magnitude of evoked events across individual boutons (n = 577 boutons from 13 cells). H, Cumulative frequency of spontaneous release frequency at individual boutons represented by the magenta solid line, best fit of exponential function to data represented by gray dashed line (n = 577 boutons from 13 cells), y = y0 + A*(1−exp(−x/mu)); y0 = 0; A = 0.983; mu = 0.016. I, Amplitude of spontaneous release events (DF/F) in the presence of TTX (n = 1,969 boutons from 21 cells) or APV/CNQX (n = 2,109 boutons from 24 cells), Mann–Whitney test, p = 0.83.

