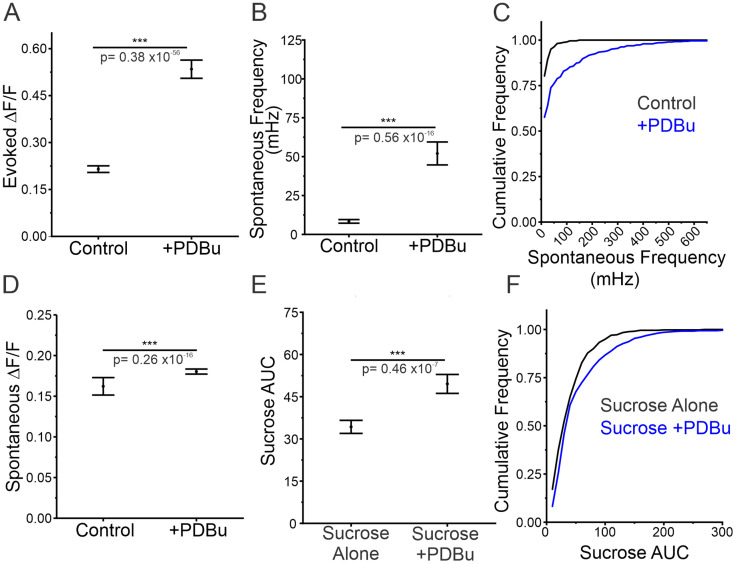
Figure 7.
Increasing RRP size using PDBu results in increase in spontaneous release frequency. A, Magnitude of evoked release in control conditions or in PDBu treatment (n = 481 boutons from 7 cells), Mann–Whitney test, p = 0.38 × 10−56 < 0.001. B, Spontaneous release frequency in control conditions or in PDBu treatment, n = 481 boutons from seven cells, Mann–Whitney test, p < 0.001. C, Cumulative frequency of spontaneous release frequency across individual boutons in control conditions and PDBu treatment. D, Amplitude of spontaneous release events in control conditions or in PDBu treatment, n = 481 boutons from seven cells, Mann–Whitney test, p = 0.26 × 10⁻¹⁶ < 0.001. E, AUC in response to sucrose alone or sucrose + PDBu, sucrose alone: n = 460 boutons from nine cells; sucrose + PDBu: n = 481 boutons from seven cells, Mann–Whitney test, p7 < 0.001. F, Cumulative frequency of sucrose AUC sizes in response to sucrose alone or sucrose + PDBu. For all statistics, exact p values are given in figure panels.

