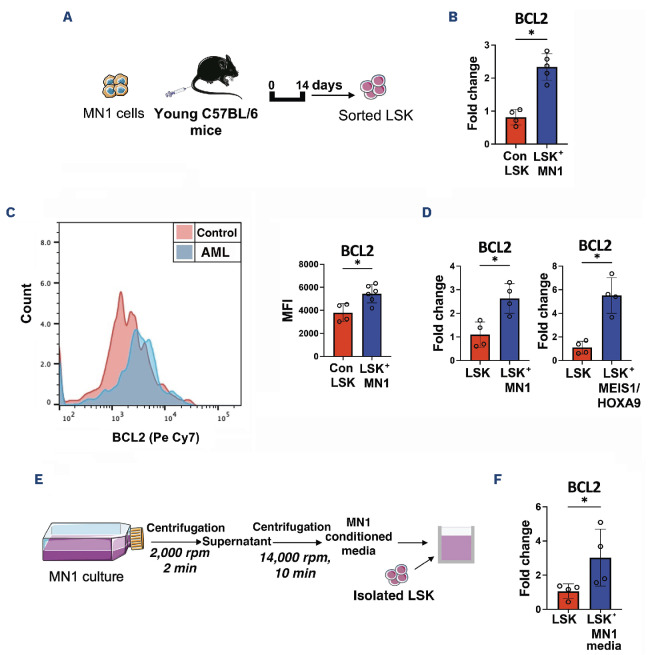
Figure 2.
Acute myeloid leukemia drives an upregulation of BCL2 in non-malignant Lin- Sca1+ CD117+. (A) Experimental schematic. 2.5x10⁶ MN1 cells were injected into 12-14-week old female non-conditioned C57BL/6 mice. Lin- Sca1+ CD117+ (LSK) cells were sorted by FACS on day 14. (B) Real-time qPCR assessed BCL2 gene expression in LSK in MN1-engrafted mice (N=5) compared to control mice (N=5). qPCR assay was performed with the SYBR-green technology (PCR Biosystems, UK)8 on QuantStudio 5 PCR system using BCL2 (Mm_Bcl2_vb.1_SG QuantiTect Primer Assay, GeneGlobe ID QT01057224) and GAPDH (Mm_Gapdh_3_SG QuantiTect Primer Assay, GeneGlobe ID QT01658692) primers from Qiagen. (C) BCL2 protein level in LSK quantified by mean fluorescence intensity (MFI) in MN1-engrafted mice (N=6) and control mice (N=6) using flow cytometry. (D) LSK were isolated from bone marrow (BM) of young C57BL/6 mice and 5x10⁴ cells were co-cultured in transwells with either MN1 or MEIS1/HOXA9 cells for 48 hours (hr) in Dulbecco’s Modified Eagle’s Medium (DMEM) supplemented with 10% fetal bovine serum (FBS), 1% penicillin streptomycin (Pen-Strep). Real-time qPCR assessed BCL2 gene expression in LSK co-cultured with acute myeloid leukemia (AML) cells (N=4) compared to LSK-only controls (N=4). (E) Schematic for cell-free conditioned media extraction from MN1 cells. Isolated LSK were cultured with MN1-conditioned media for 48 hr. (F) Real-time qPCR assessed BCL2 gene expression in LSK with MN1-conditioned media (N=4) versus LSK-only controls (N=4). All data in (B-D) and (F) are represented as median + interquartile range. *P<0.05 by Mann-Whitney U test. min: minutes.

