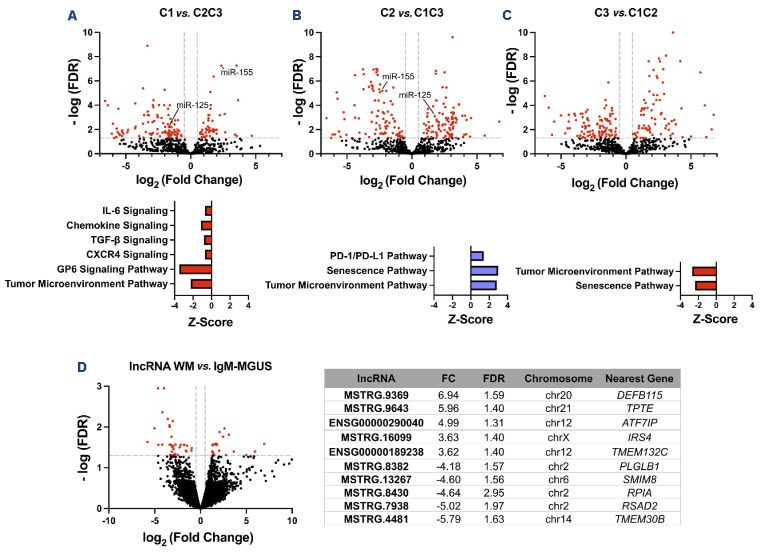
Figure 2.
MicroRNA analysis by cluster and long non-coding RNA analysis comparing Waldenström macroglobulinemia to IgM-monoclonal gammopathy of undetermined significance. (A-C) MicroRNA (miRNA) expression analysis by cluster with pathway analysis and (D) long non-coding RNA (lncRNA) expression data comparing Waldenström macroglobulinemia to IgM-monoclonal gammopathy of undetermined significance with the top ten dysregulated lncRNA. The cluster pathways demonstrated were based only on concordant pathway analysis as compared to previously published protein-based pathway data. Dotted lines on the volcano plot indicate thresholds for significance for fold change and false discovery rate. Red markers indicate differentially expressed miRNA/lncRNA. Black markers indicate non-differentially expressed miRNA/lncRNA. The table listing the top ten dysregulated lncRNA also presents the corresponding fold change, false discovery rate, chromosomal location and nearest gene. Figure created using GraphPad Prism. miR: microRNA; WM: Waldenström macroglobulinemia; IgM: immunoglobulin M; MGUS: monoclonal gammopathy of undetermined significance; FDR: false discovery rate.

