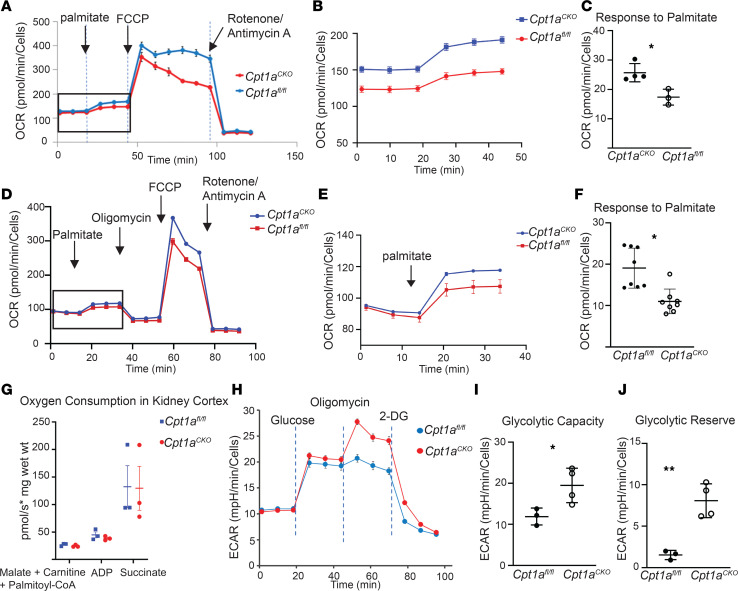
Figure 6. Primary proximal tubule–enriched cells lacking Cpt1a have altered metabolism but are still able to metabolize LCFA.
Representative data from Seahorse analysis show oxygen consumption rate (OCR) after treatment with palmitate, FCCP, and antimycin A/rotenone in primary proximal tubule–enriched cells (PT cells) from aged mice (A). An expanded view (boxed area in A) of the OCR response to palmitate is shown (B). Average OCR responses to palmitate from Cpt1afl/fl (n = 4) and Cpt1aCKO (n = 3) mice are quantified (C). Representative tracing from PT cells isolated from young mice showing OCR after palmitate, oligomycin, FCCP, and antimycin A/rotenone (D) with an expanded view of the response to palmitate (E) and quantification of this palmitate response with n = 8 per genotype (F). Kidney tissues from young Cpt1afl/fl and Cpt1aCKO mice were used to measure oxygen consumption in response to palmitoyl-CoA, a LCFA (G). Each dot represents a separate kidney (n = 3), and oxygen consumption is measured as picomole per second per mg of kidney (wet weight). Representative data from a glycolysis test measuring extracellular acidification rate (ECAR) are shown (H). Oligomycin is used to detect maximal glycolytic capacity, and 2-DG blocks glycolytic acidification to define the glucose-dependent ECAR (I). Glycolytic capacity of primary PT cells from young and old mice (each dot represents a separate mouse n = 3–4) and glycolytic reserve (the ECAR value after oligomycin minus that after the addition of glucose) are shown (J). Results are shown as the mean ± SD. *P < 0.05, **P < 0.01. Unpaired t test between the 2 genotypes was used to detect statistical significance. FCCP, carbonyl cyanide-4 (trifluoromethoxy) phenylhydrazone; 2-DG, 2-deoxy-glucose; LCFA, long-chain fatty acid.

