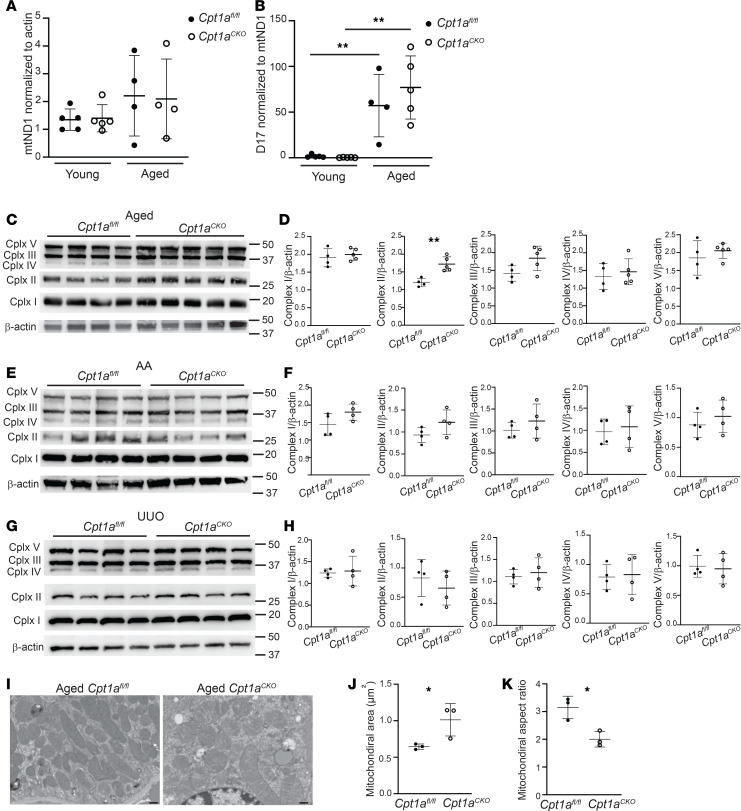
Figure 7. Assessment of Cpt1a tubular deletion on mitochondria.
Mitochondrial DNA copy number was measured using mitochondrial-encoded ND1 gene expression and normalized to nuclear-encoded actin (n = 4–5) (A). The common mitochondrial mutation, D17, was measured using qPCR and normalized to mitochondrial ND1 expression (n = 4–5) (B). Mitochondrial complexes were measured and quantified using immunoblots on cortical kidney tissue using ImageJ from aged (C and D), aristolochic acid–treated (AA-treated) (E and F), and UUO-injured mice (n = 4–5) (G and H). Representative electron micrograph images are shown (I) from aged mice, with quantification of area and aspect ratio (J and K) (see Methods). Each dot represents an average value for 1 mouse (n = 3). Results are shown as the mean ± SD. *P < 0.05; **P < 0.01. Unpaired t test between the 2 genotypes was used to detect statistical significance, except for A and B, where 1-way ANOVA was performed, followed by Šidák’s multiple comparisons. Scale bar: 500 nM.

