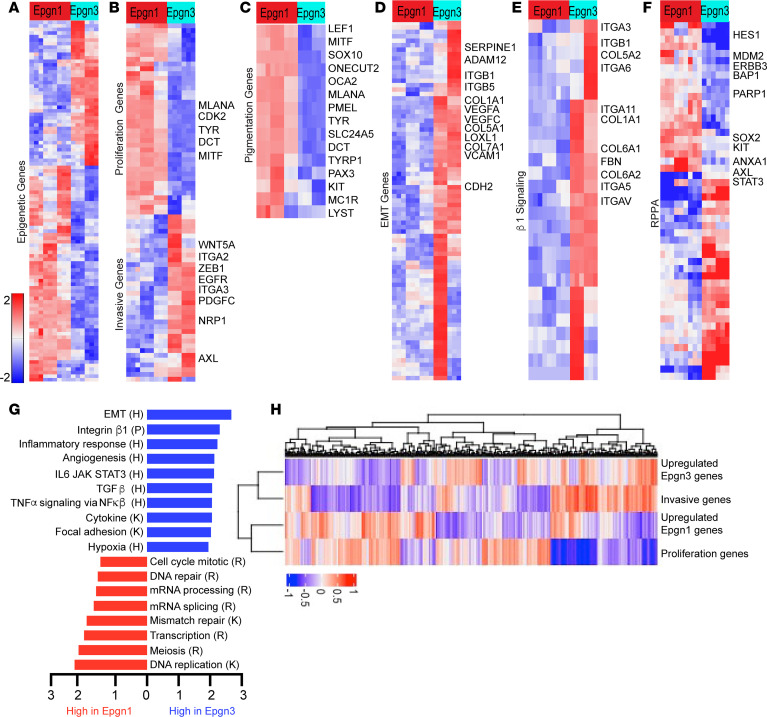
Figure 1. Epigenetic gene signature classifier (Epgn1/Epgn3) underlies reprogramming of melanoma cells from a proliferative to an invasive cellular state.
RNA-Seq of Epgn1 cell lines (n = 3; WM35, YUPEET, WM983A) and Epgn3 cell lines (n = 2; WM1552C, YUCHIME). The top bar indicates cellular subtypes (Epgn1 [red] and Epgn3 [light blue]) as characterized by the 122-epigenetic signature (Supplemental Figure 1A). Each row of the heatmap indicates a differentially expressed gene, and each column represents a BRAFV600 mutant cell line (n = 5; each in triplicate). Differentially expressed genes are significant if q < 0.05 by Benjamini-Hochberg procedure and a linear fold-change ± 1.5. The heatmaps are color-coded on the basis of Z scores. (A) Supervised hierarchical clustering of 122 epigenetic genes and identification of Epgn1 and Epgn3 groups. (B) RNA-Seq analysis identifies increased expression of proliferative and differentiation genes (MLANA, TYR, DCT, MITF) in the Epgn1 group and increased expression of invasive genes (WNT5A, ITGA2, ZEB1, EGFR, ITGA3, PDGFC, NRP, AXL) in the Epgn3 group using the Hoek proliferative and invasive gene signature (2). (C) Pigmentation pathway genes (MITF, MLANA, PMEL, TYR, DCT, TYRP1) were uniformly upregulated in Epgn1 cells. (D and E) Differential expression of genes involved in epithelial mesenchymal transition (EMT) and integrin signaling. (F) Heatmap of 51 significantly differentially expressed proteins (after multitesting correction at FDR 5%) determined by reverse phase protein array (RPPA) coincides with transcriptional data. (G) GSEA pathway analysis. Pathways are abbreviated as follows: K, KEGG; R, Reactome; H, Hallmark; P, Pathway Interaction Database. (H) RNA-Seq data set of TCGA melanomas (n = 473). ssGSEA analysis depicting correlation between the upregulated Epng1 gene signature with the proliferative genes (P = 1.069 × 10⁻⁶; OR, 2.61), and the upregulated Epgn3 signature with the invasive genes (P = 8.595 × 10⁻⁶; OR, 2.46).

