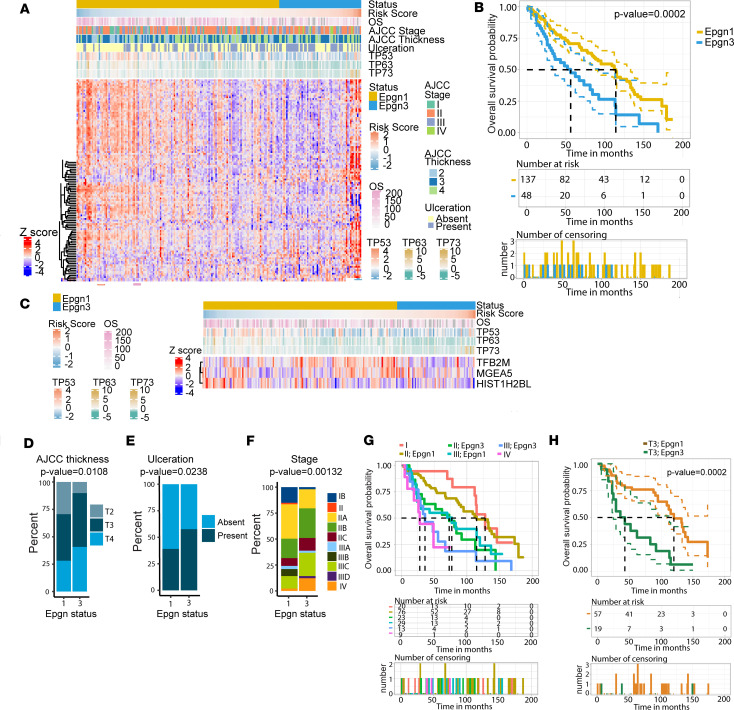
Figure 2. Epgn1/Epgn3 gene signature classifies primary melanoma tumor samples into low- versus high-risk groups.
(A) Heatmap of a cohort of primary cutaneous melanoma samples (n = 205). The heatmap depicts expression of 118 epigenetic genes from our signature along with TP53 family and housekeeping genes. Each row of the heatmap indicates a differentially expressed gene (n = 118), and each column represents a tumor sample (n = 205). The status bar indicates the classifier: Epgn1 (gold) and Epgn3 (light blue). The overall survival (OS) risk score, AJCC thickness, ulceration, stage, and OS (number of months) is color-coded as indicated. (B) Kaplan-Meier survival curves for Epgn1 (gold) and Epgn3 (blue) subgroups. (C) Heatmap showing the minimum number of epigenetic genes (HIST1H2BL, MGEA5, TFB2M) that correlated with OS. Correlation with our OS risk score allows for the identification of our 2 groups Epgn1 (gold) and Epgn3 (blue). TP53, TP63, and TP73 gene expression are depicted. Cox regression model was used. (D) The AJCC tumor thickness in the Epgn1 group versus the Epgn3 group (P = 0.0108). (E) Ulceration in the Epgn1 group versus the Epgn3 group (P = 0.0238). (F) Stage in the Epgn1 group versus the Epgn3 group (P = 0.00132). One-way ANOVA test was used (D–F). (G) Kaplan-Meier curve showing the Epgn1/Epgn3 risk classifier in discriminating better versus poor OS by Stage. (H) Kaplan-Meier curve showing the Epgn1/Epgn3 risk classifier in discriminating better versus poor OS for patients with T3 tumors (P = 0.0002).

