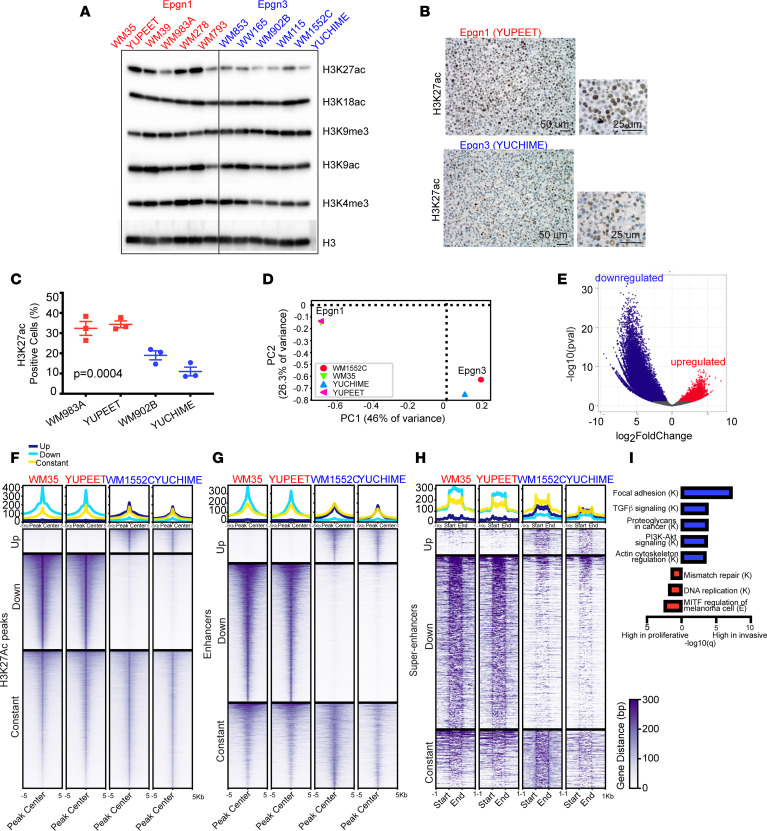
Figure 3. Reorganization of super-enhancer and enhancer landscape in Epgn1/Epgn3 melanoma cells.
(A) Immunoblotting of the chromatin fraction of Epgn1 and Epgn3 cells for H3K27ac, H3K18ac, H3K9me3, H3K9ac, and H3K4me3. Total H3 indicates loading. (B) IHC of H3K27ac in YUPEET, a representative Epgn1 cell line and YUCHIME, a representative Epgn3 cell line. Scale bars: 50 μm (left), 25 μm (right). (C) Quantification of data generated in 2 Epgn1 cell lines WM983A and YUPEET (red) as compared with 2 Epgn3 cell lines WM902B and YUCHIME (light blue). P = 0.0004. One-way ANOVA test was used. (D and E) ChIP-Seq for H3K27ac using representative Epgn1 cells, WM35 and YUPEET, and representative Epgn3 cells, WM1552C and YUCHIME. PCA plot indicating the separation of groups. Volcano plot showing a total of 85,858 peaks from differential peak analysis: 7,924 upregulated peaks in the Epgn3 group, and 31,511 downregulated peaks in the Epgn3 group (upregulated in the Epgn1 group). (F) Heatmap of differential peak analysis. Data are presented on ± 5 kb around the peak center. DiffBind package was used. (G) Heatmap of differential enhancer analysis. Data are centered on ± 5 kb window. A total of 2,220 significant enhancers were identified in the Epgn3 cell lines and 9,074 significant enhancers were identified in the Epgn1 cell lines. (H) Heatmap of differential super-enhancer analysis. Data are shown ± 1 kb upstream and downstream of the super-enhancer. A total of 83 and 533 significant super-enhancers were identified in the Epgn3 and Epgn1 cell lines, respectively. ROSE algorithm was used. (I) GSEA (KEGG pathway) analysis identifies super-enhancers and enhancers associated with functional pathways. K, KEGG; E, Elsevier.

