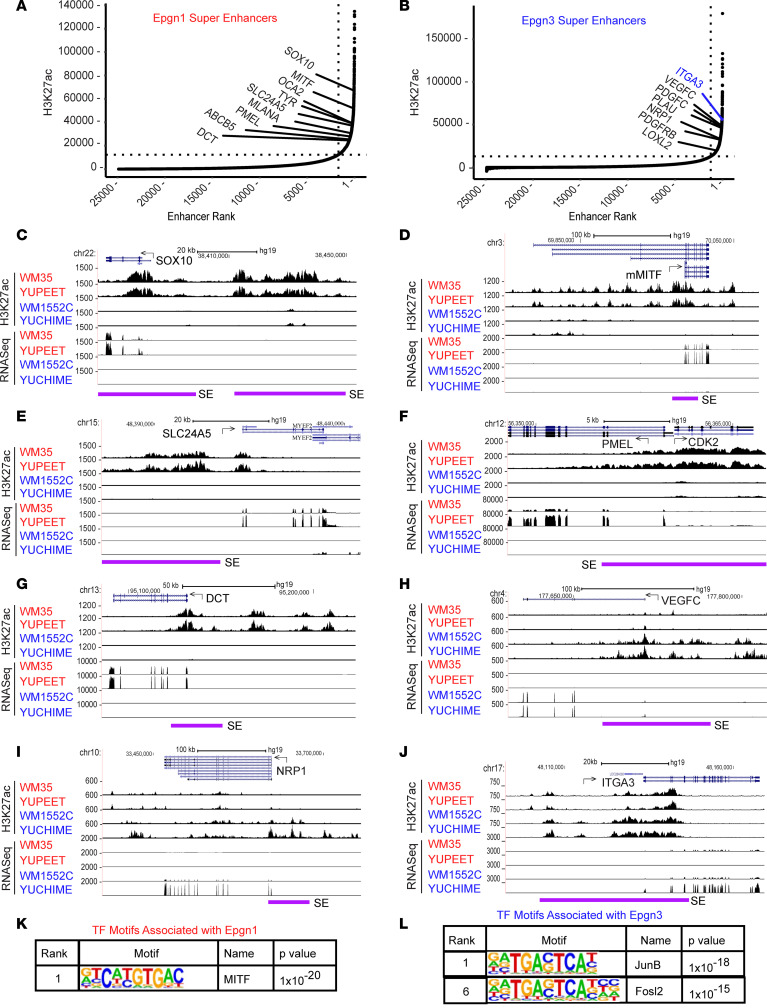
Figure 4. Super-enhancers are associated with MITF lineage genes in Epgn1/proliferative cell lines and cell motility genes in Epgn3/invasive cell lines.
(A) Ranked order of H3K27ac normalized reads at super-enhancer and enhancer loci in Epgn1 cell lines. Super-enhancers that associated with genes belonging to the MITF lineage specific pigmentation pathway in the Epgn1 cell lines are shown. (B) Ranked order of H3K27ac normalized reads at super-enhancer and enhancer loci in Epgn3 cell lines. Super-enhancers associated with invasive genes in the Epgn3 cell lines are shown. ROSE algorithm was used. (C–G) UCSC genome browser captures of H3K27ac and RNA-Seq enrichment profiles are shown for selected Epgn1 genes and their super-enhancers including SOX10 (C); the melanocyte specific MITF isoform, mMITF (D); SLC24A5 (E); PMEL and CDK2 (F); and DCT (G). (H–J) H3K27ac traces along with corresponding RNA-Seq peaks are shown for selected Epgn3 genes including VEGFC (H), NRP1 (I), and ITGA3 (J). Super-enhancer regions are denoted by purple line. (K) The top motif and corresponding transcription factors associated with Epgn1 super-enhancers. (L) The top motifs and corresponding transcription factors associated with Epgn3 super-enhancers. Fisher’s exact test was used (K and L).

