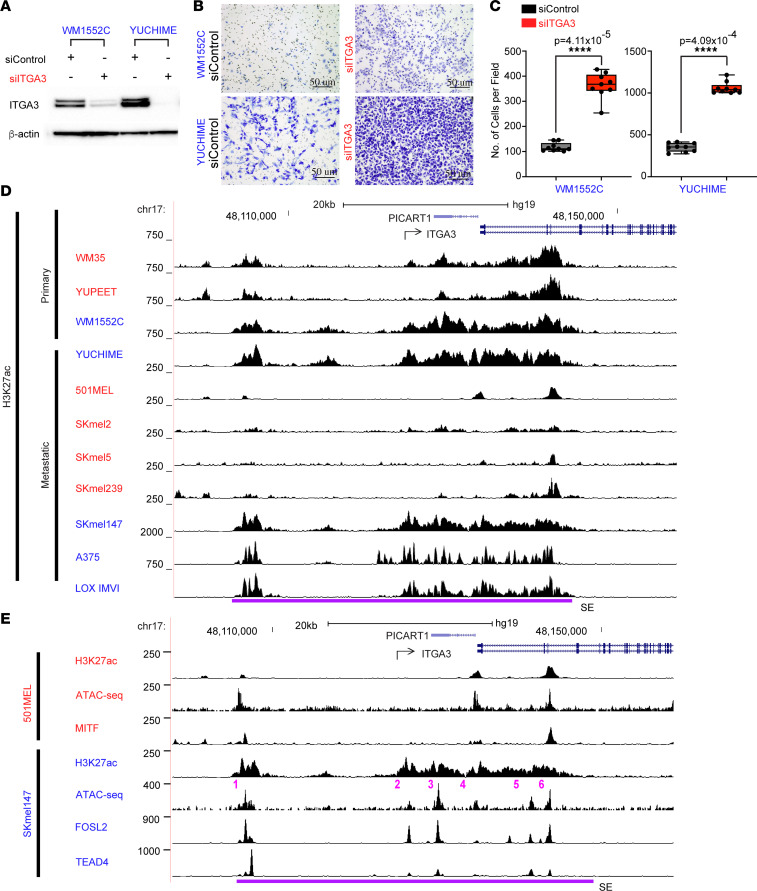
Figure 5. ITGA3 suppresses invasion and is associated with super-enhancer–mediated regulation in Epgn3 cells.
(A) ITGA3 immunoblot of lysates following transfection with siControl or siITGA3. Actin was used as a loading control. (B) Representative examples of cells following invasion in a matrigel coated Boyden chamber model. Scale bars: 50 μm. (C) Quantification of invasion assay shown in B. Two groups are compared: siControl and siITGA3 in the Epgn3 primary melanoma cell lines. P = 4.11 × 10⁻⁵ for WM1552C and P = 4.09 × 10⁻⁴ for YUCHIME. Mann Whitney U test was used. (D) H3K27ac ChIP-Seq peaks in the Epgn1 primary and metastatic cell lines (red) and in the Epgn3 primary and metastatic cell lines (blue). Super-enhancer region is denoted with a purple line. (E) H3K27ac, ATAC-Seq, and MITF ChIP-Seq peaks in the Epgn1 cell line 501MEL. H3K27ac, ATAC-Seq, FOSL2, and TEAD4 ChIP-Seq peaks in the Epgn3 cell line SKmel147.

