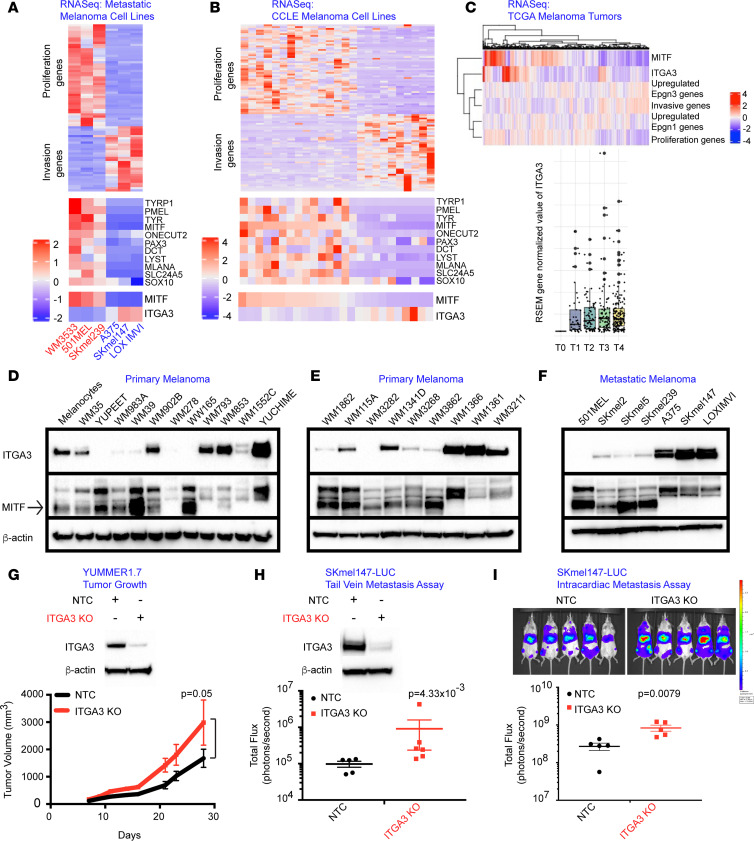
Figure 6. ITGA3 is overexpressed in Epgn3 high-risk melanomas and negatively regulates an invasive phenotype.
(A) Heatmaps of proliferation, invasion, and pigment pathway genes MITF and ITGA3 in the metastatic melanoma cell lines. (B) Heatmaps of proliferation, invasion, and pigment pathway genes MITF and ITGA3 in the CCLE melanoma cell lines. (C) ssGSEA depicting correlations between proliferation, invasion, Epgn1, and Epgn3 gene signatures with MITF and ITGA3 (upper panel). Dot plot of the ITGA3 expression for AJCC tumor stages, T0-T4 (TCGA melanoma data set, lower panel). (D–F) Western blotting for ITGA3, MITF, and actin in the primary (D and E) and the metastatic melanoma cell lines (F). (G) Immunoblotting of ITGA3 and actin in the nontargeting control (NTC) and ITGA3-KO YUMMER1.7 cells. Tumor growth assay following the injection of the NTC and ITGA3-KO YUMMER1.7 cells in mice. P = 0.05. (H and I) Immunoblotting of ITGA3 and actin in the NTC and ITGA3 KO SKmel147 luciferase cells (H). Tail vein (H) and intracardiac metastasis (I) assays following the injection of the nontargeting control NTC and ITGA3 KO cells in mice, P = 4.33 × 10⁻³ and P = 0.0079, respectively. Mann Whitney U test was used (G–I).

