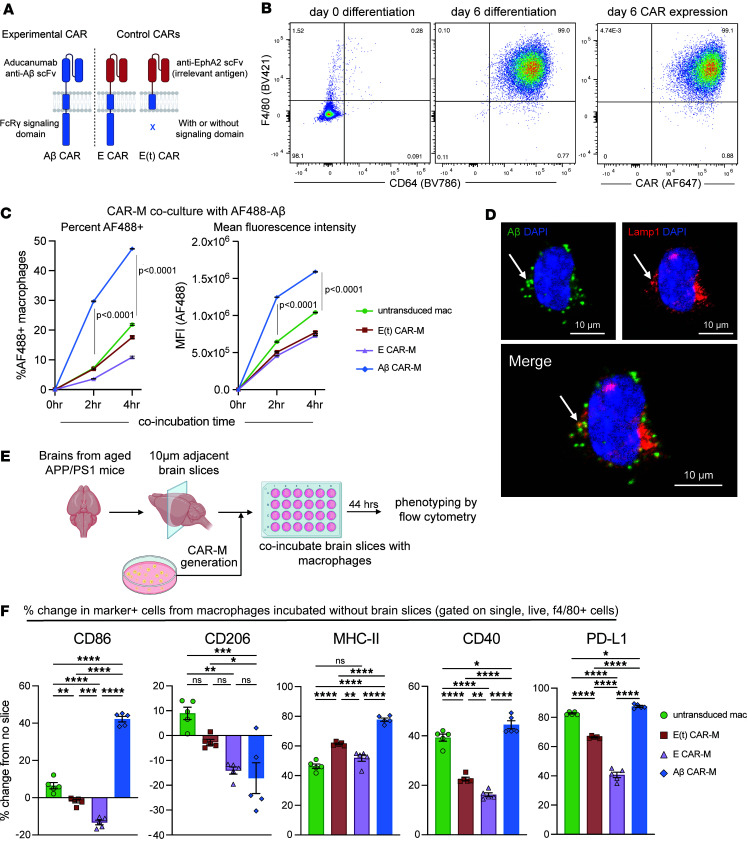
Figure 1. Generation, validation, and phenotype of an aducanumab-based Aβ CAR-M.
(A) Schematic diagram of Aβ CAR and control CAR constructs. scFv, single-chain variable fragment; E CAR, EphA2 scFv CAR; E(t) CAR, EphA2 truncated CAR. (B) Representative FACS plots of (left) F4/80 and CD64 surface expression on HoxB8 cells at day 0 and day 6 of differentiation with M-CSF and (right) surface CAR expression on cells at day 6 of differentiation. (C) In vitro uptake of Alexa Flour 488 fluorescent tagged Aβ (1–42 aa) by untransduced, control, or Aβ CAR-Ms after 2 or 4 hours of coincubation, depicted as percent uptake (left) or geometric mean fluorescence intensity (MFI, right). (D) Representative immunofluorescence microscopy images of Aβ CAR-Ms incubated with AF-488–tagged Aβ (1–42 aa) for 4 hours and stained for Lamp1. Scale bars: 10 μm. (E) Schematic of flow-based phenotyping of untransduced macrophages, control CAR-Ms, or Aβ CAR-Ms coincubated with amyloid-laden brain slices from aged APP/PS1 mice for 44 hours prior to flow cytometry analysis. (F) Percent change in the stated marker after coincubation of untransduced, control, or Aβ CAR-Ms on amyloid-laden brain slices from APP/PS1 mice from the expression of the same markers on the same cells incubated without brain slices. Data are represented as mean ± SEM from n = 2 independent experiments with 3–5 technical replicates for each condition (C) and 5 technical replicates (F). Statistical significance was calculated with a repeated measures 2-way ANOVA (C) or 1-way ANOVA (F) with Tukey’s multiple-comparison tests. For F, *P < 0.05, **P < 0.01, ***P < 0.001, ****P < 0.0001.

