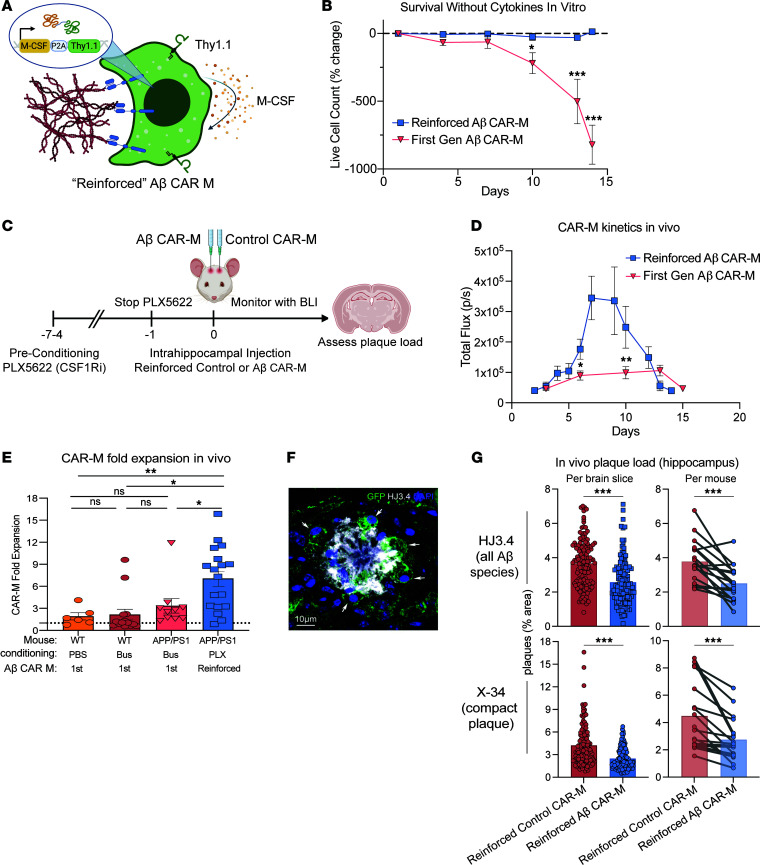
Figure 3. M-CSF reinforced Aβ CAR-Ms have improved survival and reduce plaque load in vivo.
(A) Schematic of M-CSF expressing construct retrovirally introduced into control and Aβ CAR-M, which contains the M-CSF gene followed by a P2A cleavage sequence and Thy1.1. (B) Percent change in live cell count of first-generation Aβ CAR-Ms and M-CSF reinforced Aβ CAR-Ms upon removal of M-CSF from the culture medium in vitro, determined by flow cytometry staining with Zombie NIR live/dead staining. Cells were differentiated for 6 days in M-CSF to become mature macrophages, prior to M-CSF removal. Statistical significance was calculated with an unpaired 2-tailed t test. (C) Schematic of PLX5622 preconditioning and intrahippocampal injection of M-CSF reinforced Aβ CAR-Ms. (D) Total flux determined by noninvasive bioluminescence imaging (BLI) tracking first-generation Aβ CAR-M kinetics in vivo compared with M-CSF reinforced Aβ CAR-M kinetics after intrahippocampal injection. “Days” indicates days after intrahippocampal injection. n = 10–18 mice per group. Statistical significance was calculated with unpaired 2-tailed t tests. (E) Fold-expansion of CAR-Ms from the first day of BLI after intrahippocampal injection of cells to the day of maximum total flux measured by BLI. n = 6–18 mice per group. Statistical significance was calculated with 1-way ANOVA with Tukey’s multiple-comparison test. (F) Representative immunofluorescence microscopy image of M-CSF reinforced Aβ CAR-Ms binding to amyloid plaque in vivo. Scale bar: 10 μm. (G) Assessment of plaque load after intrahippocampal injection of M-CSF reinforced control CAR-M or M-CSF reinforced Aβ CAR-M in n = 12 (14-month-old female APP/PS1 mice) and n = 6 (13-month-old male APP/PS1 mice). Arrows point to GFP+ CAR-Ms bound to and phagocytosing amyloid plaque. Mice were sacrificed on day 12 or 13 after intrahippocampal injection, and brain tissue was sectioned and stained with HJ3.4 and X-34 to assess plaque load. Data are shown as mean ± SEM. Statistical significance was calculated with unpaired 2-tailed t tests for brain slice data and paired 2-tailed t tests for per mouse data. For B–D, *P < 0.05, **P < 0.01, ***P < 0.001.

