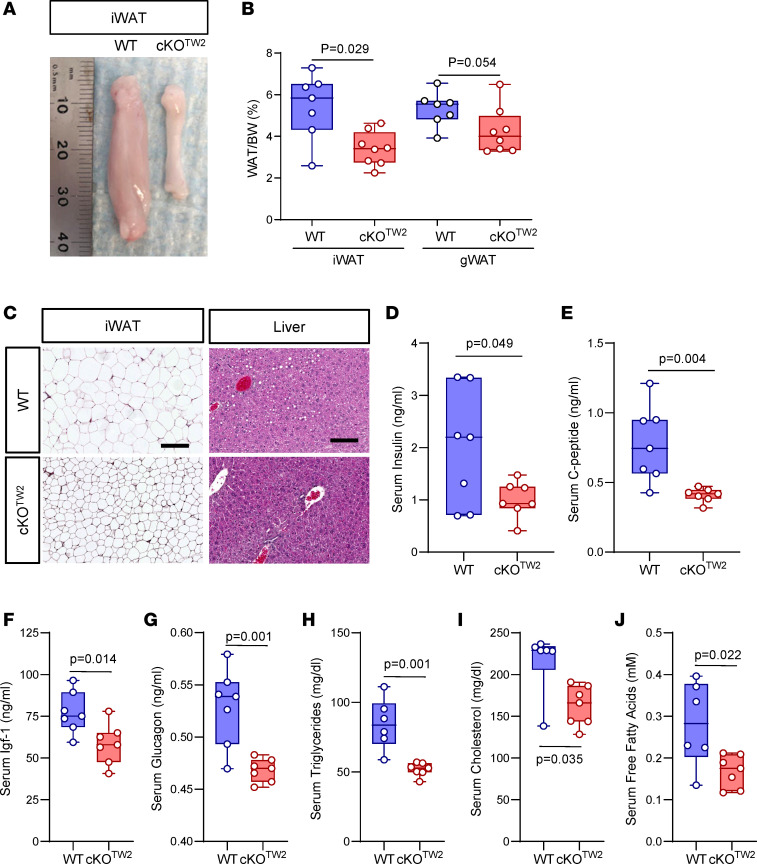
Figure 4. Gja1 ablation in mesenchymal lineage cells protects HFD-induced expansion of fat depots and adipocyte hypertrophy in male mice.
(A) Representative morphology of inguinal WAT (iWAT) in 2-month-old WT and cKOTW2 male mice after 12 weeks on an HFD. (B) Percentage iWAT and gonadal WAT (gWAT) relative to body weight in the 2 genotypes after HFD. (C) Representative H&E-stained histological sections of iWAT and liver of WT (n = 7) and cKOTW2 (n = 8) mice after 12 weeks on HFD. Scale bars: 50 μm. Serum levels of (D) insulin, (E) C-peptide, (F) Igf-1, (G) glucagon, (H) triglyceride, (I) cholesterol, and (J) fatty acid measured in WT and cKOTW2 mice after 12 weeks on HFD. Box-and-whisker plots represent the interquartile range (box bounds) with median (inside bar); whiskers represent maximum and minimum values. P values were determined by 2-sided Mann-Whitney U test.

