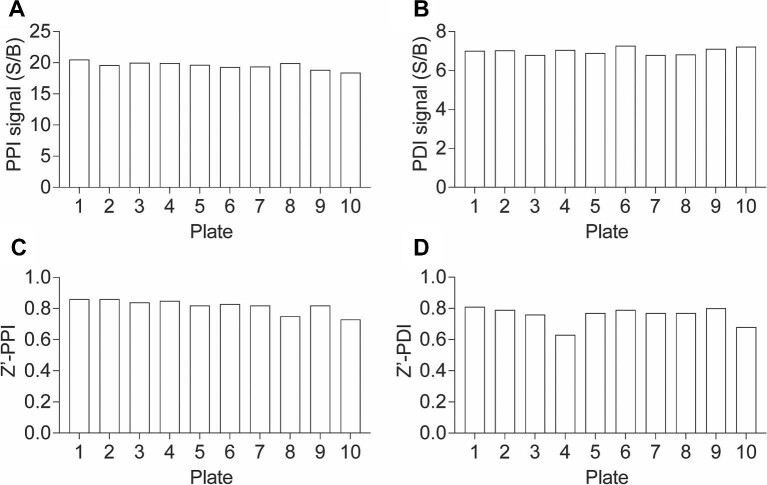
Figure 5.
uHTS assay quality control. (A and B) Bar graphs showing the S/B ratios of PPI (A) and PDI (B) readouts across 10 plates from the primary screen. The data are expressed as the mean calculated from 16 replicates from the primary screen. (C and D) Bar graphs showing the Z′ factor of PPI (C) and PDI (D) readouts across 10 plates from the primary screen.

