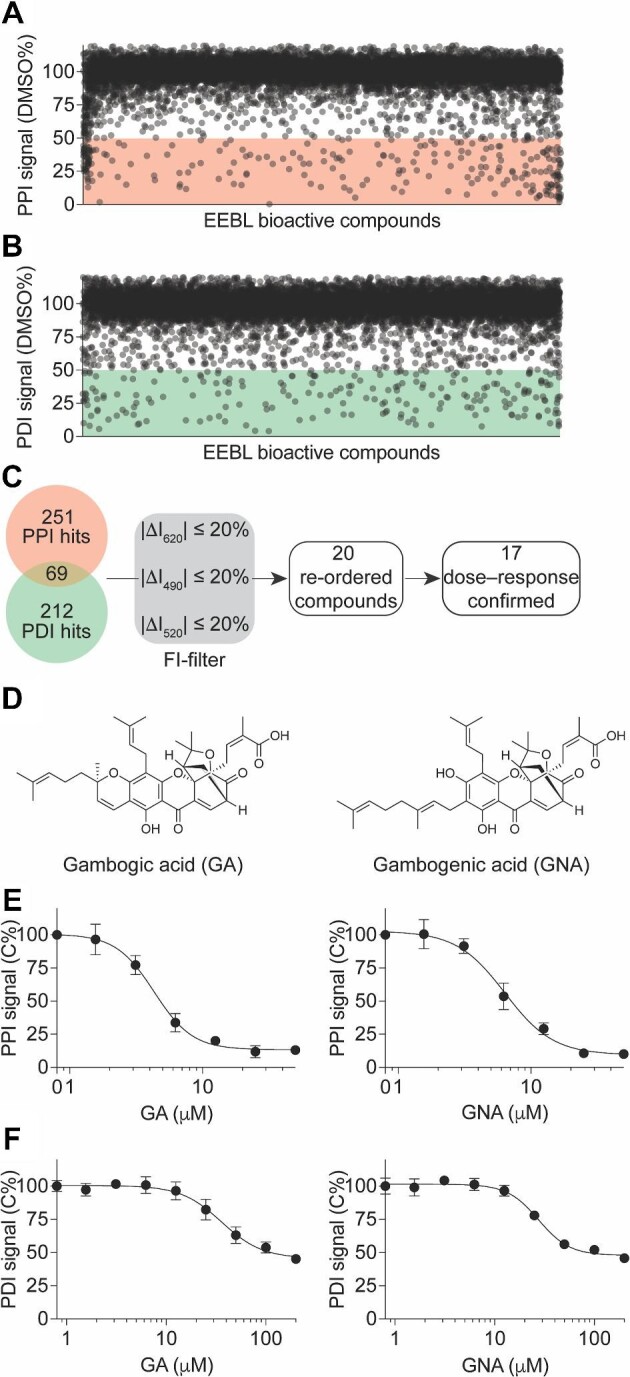
Figure 6.

Identification of GA and GNA as SMAD4–SMAD3–SBE4 complex inhibitors from a pilot screening in a 1536-well uHTS format. (A and B) Scatter plot showing the PPI (A) and PDI (B) signals induced by compounds from the primary screening. The data are presented as the percentage of the DMSO control from the primary screening. (C) Flow chart showing the prioritization of the primary hits. (D) Chemical structures of two primary hits, GA and GNA. (E and F) Dose-dependent curves of GA (left) and GNA (right) in inhibiting the PPI (E) and PDI (F) signals. The data are presented as mean ± SD from triplicates from one representative experiment.
