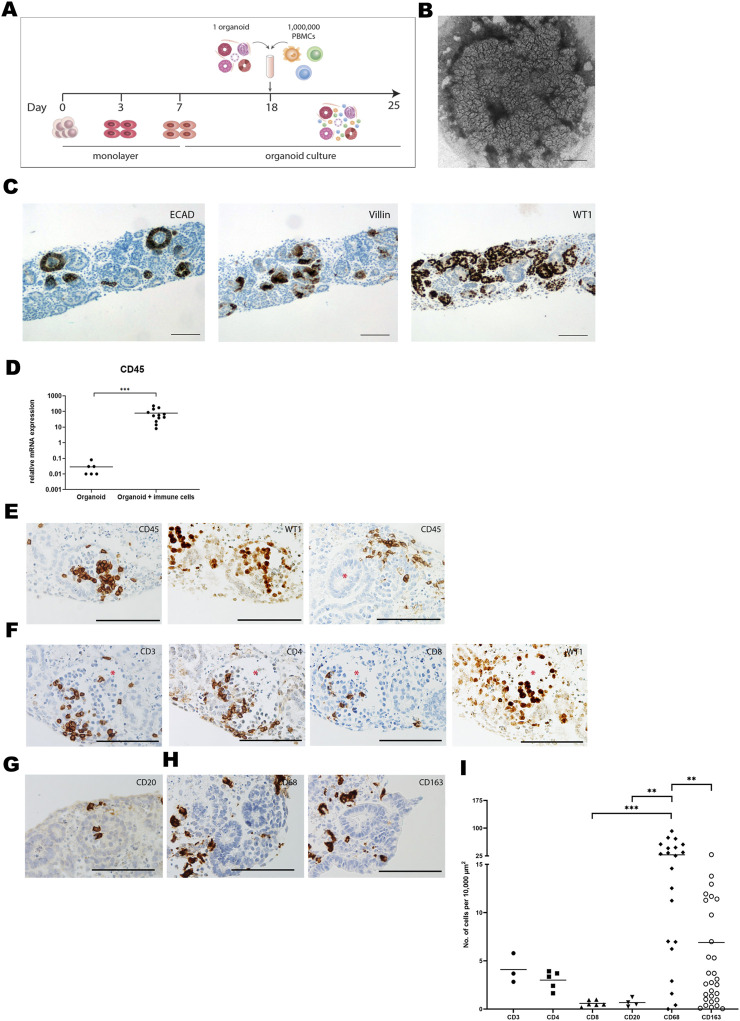
FIGURE 1.
Immune cells infiltrate kidney organoids in vitro. (A) Schematic drawing of the organoid-PBMC co-culture. (B) Brightfield image of an organoid (cultured without immune cells) harvested at day 25 of differentiation. Scale bar indicates 1 mm. (C) Expression of the distal tubular marker ECAD, the proximal tubular marker Villin and the glomerular marker WT1 in kidney organoid sections at day 25 of differentiation (without immune cells). Scale bars represent 100 µm. (D) mRNA expression of CD45 in organoid-PBMC co-culture compared to only organoid. Data is expressed as ratio with GAPDH x 1000 with SE (n = 12). (E) Immunohistochemistry for CD45 depicting infiltration of CD45+ leukocytes in glomerular (left) and stromal structures (right). Asterisk marks a tubular structure. Scale bar represents 100 µm. (F) Immunohistochemistry for CD3, CD4 and CD8 in consecutive slides showing the distribution of CD4+ and CD8+ T-cells (asterisk marks a glomerular structure). Scale bar represents 100 µm. (G) Immunohistochemistry for CD20, revealing a rare presence of B-cells. Scale bar represents 100 µm. (H) Immunohistochemistry for CD68 showing presence of macrophages in the interstitial space. CD163 staining shows the presence of regulatory macrophages. Scale bar represents 100 µm. (I) Comparison of the number of infiltrated cells for various immune cell subsets through quantification of immunohistochemical staining by image analysis.

