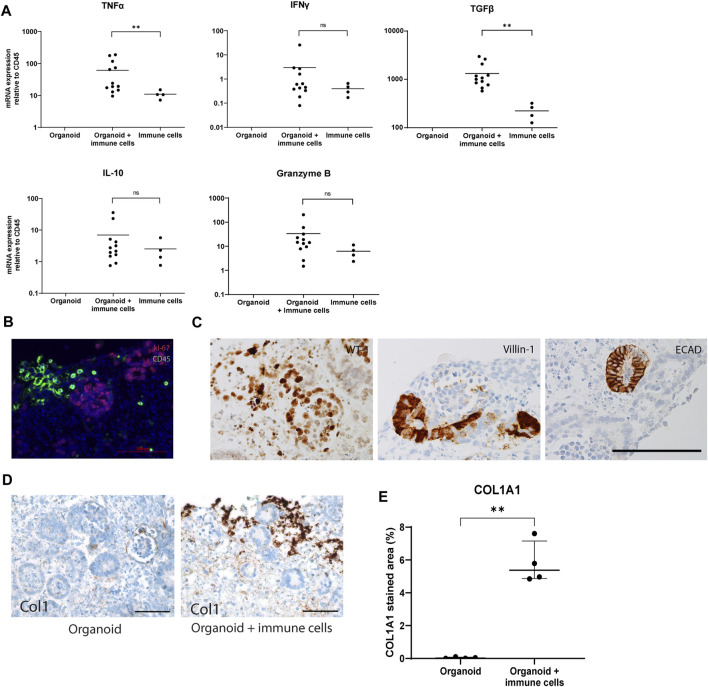
FIGURE 2.
Weak activation status of immune cells infiltrated in in vitro organoids. (A) Gene expression analysis of inflammatory cytokines. Data is expressed as ratio with GAPDH x 1000 with SE (n = 12). (B) Double immunofluorescence staining for CD45 (green) and Ki-67 (red) showing absence of proliferating leukocytes. Scale bar represents 100 µm. (C) Immunohistochemistry for differentiation markers WT1, Villin-1 and ECAD showing maintenance of differentiation in the organoids exposed to immune cells. Scale bar represents 100 µm. (D) Immunohistochemistry for collagen type 1 in organoids cultured with and without immune cells. Scale bar represents 100 µm. (E) Collagen 1 type 1 (Col1A1) quantification in immunohistochemical staining in organoids cultured with and without immune cells.

