FIGURE 3.
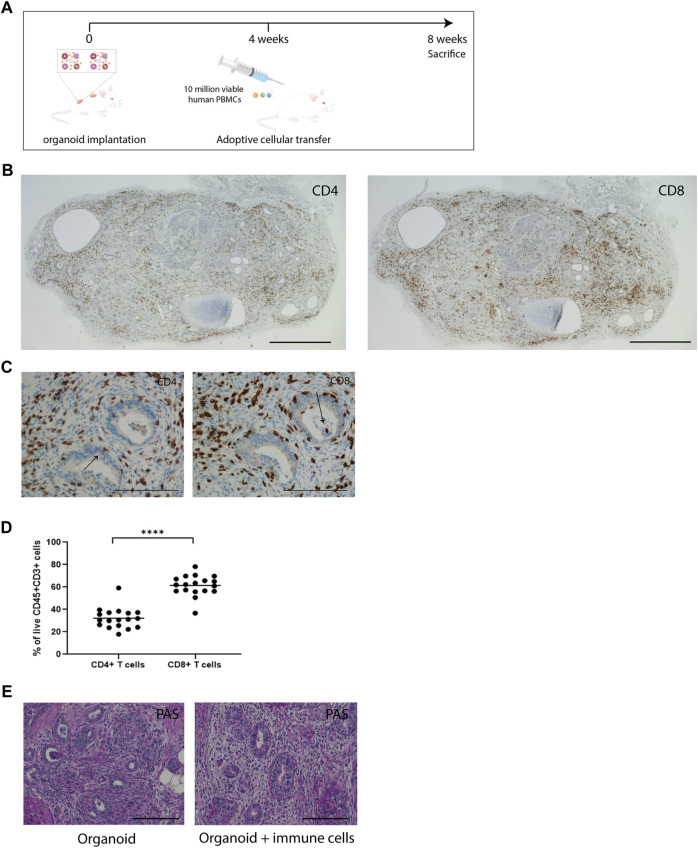
Immune cells infiltrate vascularized implanted kidney organoids. (A) Timeline of in vivo organoid implantation model and adoptive transfer of PBMC. (B) Immunohistochemical staining of CD4 and CD8 in immune cell-infiltrated whole organoids. Scale bar represents 2 mm. (C) Immunohistochemistry for CD4 and CD8 in consecutive slides in implanted organoids, showing infiltration of immune cells in all compartments of the organoids. Arrows indicate CD4 and CD8 staining in nephron structures. Scale bars represent 100 µm. (D) Proportion of CD4+ and CD8+ T-cells in organoids determined by flow cytometry (n = 18 organoids from 11 mice in 4 individual experiments). (E) Representative Periodic acid-Schiff (PAS) staining of implanted organoids retrieved from animals without immune cell administration (organoid) and from animals that received immune cells (organoid + immune cells). Scale bars represent 100 µm.

