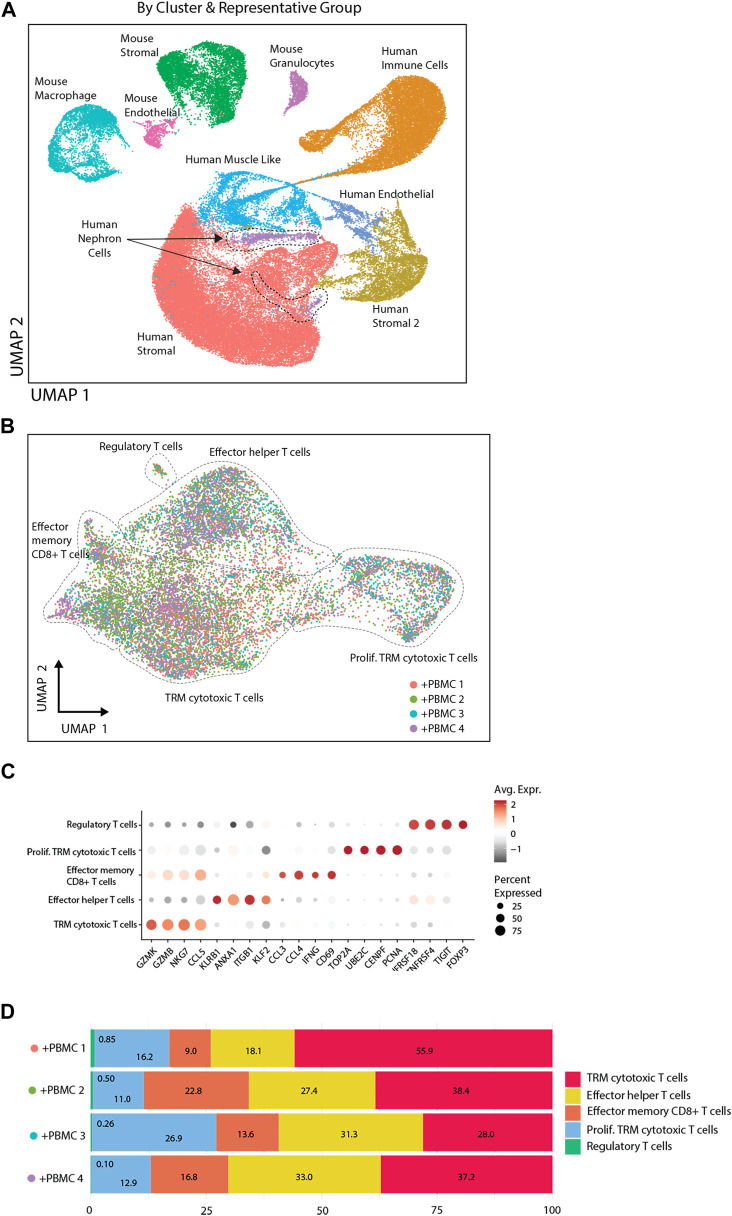
FIGURE 5.
Single cell transcriptomic analysis of implanted kidney organoids. (A) UMAP presentation of single cell transcriptomic analysis of organoid cells with and without PBMC by sample and by cell clusters identified on basis of highly variable genes. (B) UMAP representation of infiltrated immune cells. Diverse T-cell populations in the organoid are identified by Celltypist. (C) Dot plot visualization of T-cell subsets, displaying key markers for the diverse subsets indicated on the X-axis. The size of the dots reflects the frequency of T-cells in each subset that expresses the gene indicated on the X-axis, and the color of the dots reflects the level of expression. (D) Frequency distribution of T-cell subsets in four immune cell-infiltrated organoids.

