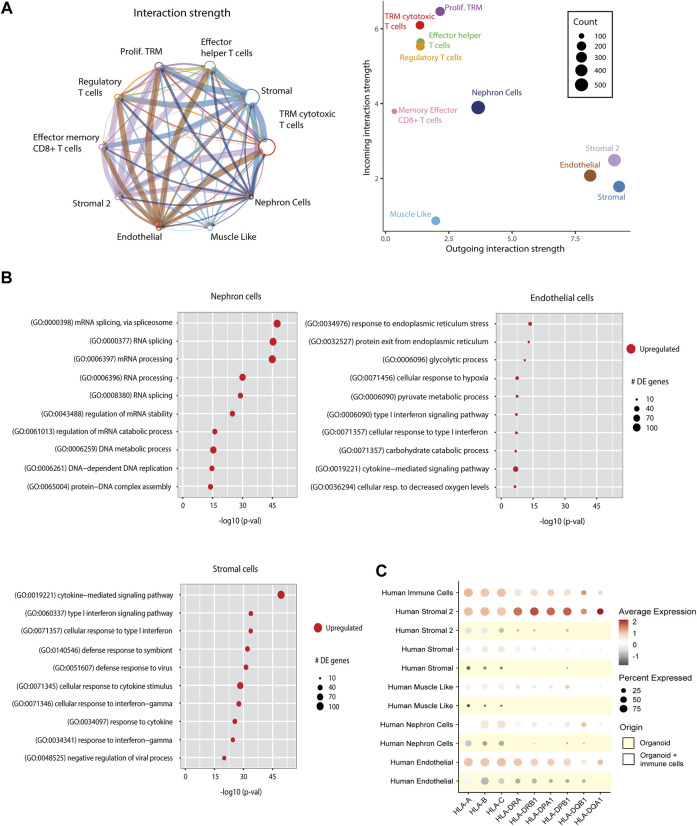
FIGURE 6.
Effect of immune cell infiltration on implanted organoids. (A) Ligand-receptor interactions in immune cell-infiltrated organoids. Left: Aggregated cell-cell communication network between all human cells from the immune cell-infiltrated organoids. Circle size denotes number of cells in each group; width of lines denotes total interaction strength between cell groups. Right: Scatter plot showing the dominant senders (ligands) and receivers (receptors). Dot size denotes total number of inferred links. Axis measure the total outgoing or incoming communication strength associated with each cell cluster. (B) Differentially expressed (DE) pathways between nephron cells, stromal cells and endothelial cells from control organoids vs. organoids infiltrated with immune cells, demonstrating upregulation of immune response pathways and metabolic pathways upon immune cell infiltration. Dot size indicates number of differentially expressed genes within the pathways. (C) Dot plot visualization comparing the expression of HLA genes in all cell types of kidney organoids with and without immune cells. Each dot represents the averaged relative gene expression of 4 organoids.

