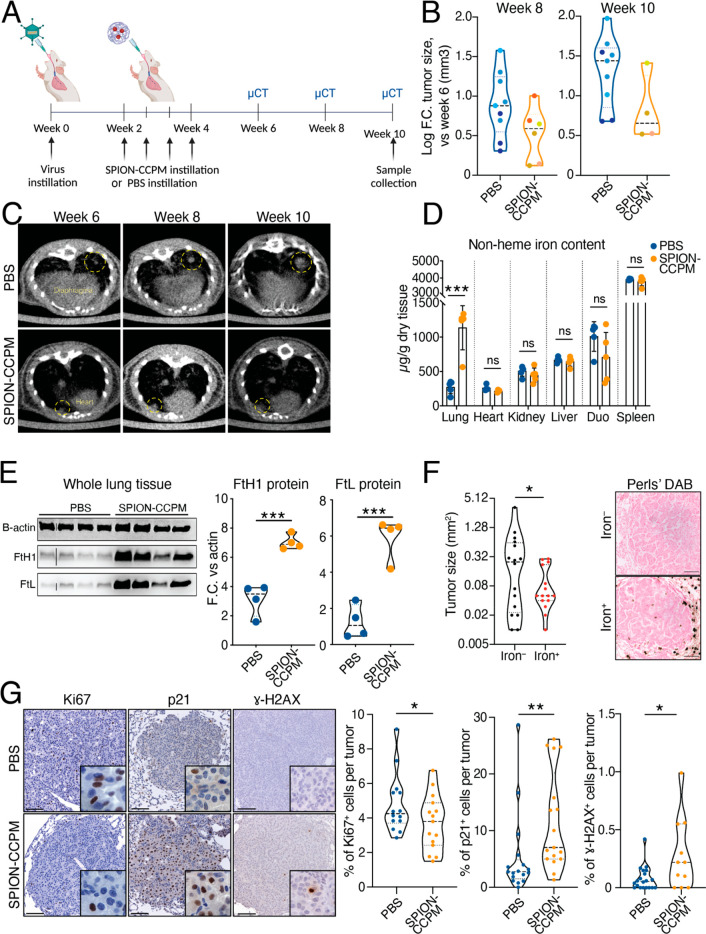
Figure 4.
SPION-CCPM instillation induces DNA damage and reduces tumor growth in mice. (A) Experimental design. (B) Tumor size at weeks 8 and 10 analyzed by μCT; data shown as log fold-change (Log F.C.) compared to week 6 (first time point measurable after viral clearance). Each dot represents a tumor which are colored according to each mouse. We applied a linear mixed model with random intercept for “animal” to account for the fact that multiple tumors were evaluated per animal. (C) Representative μCT lung images from PBS and SPION-CCPM-treated mice at weeks 6, 8 and 10; yellow circles indicate a growing tumor. (D) Nonheme iron content in organs. (E) Ferritin heavy chain 1 (FtH1), ferritin light chain (FTL) and β-actin protein detection by Western blot (left). Protein levels were quantified (right) by comparing signal protein intensity against β-actin levels and represented as F.C. (F) Size of iron– and iron+ tumors. Right, representative images of Perls’ Prussian Blue DAB staining. (G) Ki67, p21 and γ-H2AX representative tumor images (left) from PBS and SPION-CCPM-instilled tumor-bearing mice. Quantification of positive cells per tumor (right). (F, G) Scale bar 100 μm. Each dot represents a tumor (B, F, G) or a mouse (D, E). *p < 0.05, or unpaired t test (D–G). n = 5 mice per group except B, (n = 3 PBS; n = 4 SPION-CCPM) and D, E (n = 4).

