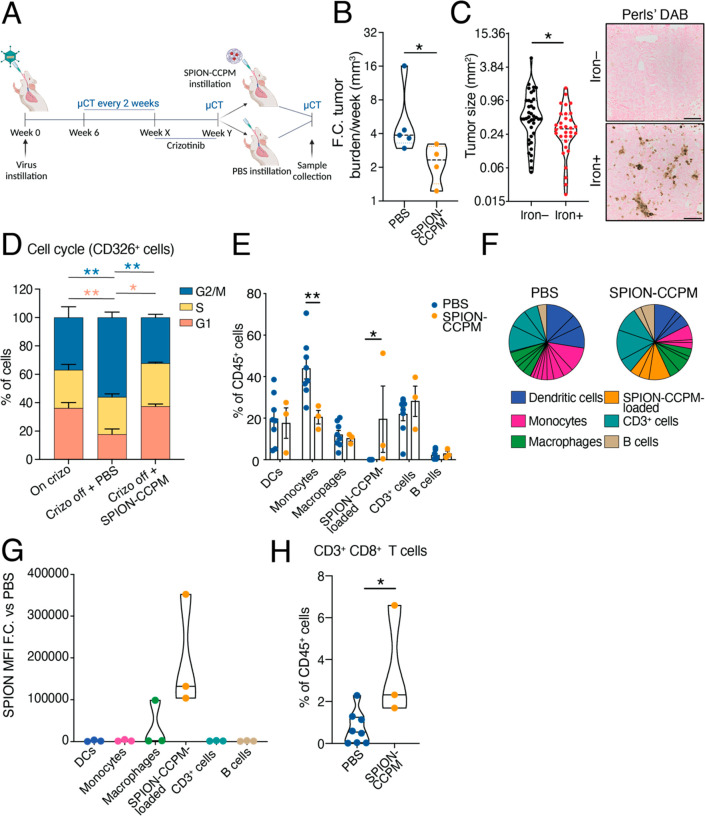
Figure 6.
SPION-CCPM treatment following crizotinib delays tumor regrowth in mice. (A) Experimental design. (B) Fold-change (F.C.) of tumor burden per week after PBS or SPION-CCPM treatment measured by μCT (left). Each dot represents a mouse. (C) Tumor size of iron+ and iron– tumors; each dot represents a tumor. DAB enhanced Perls’ Prussian Blue staining in tumor tissue (right). Scale bar 100 μm. (D) Cell cycle analysis of CD326+ cells represented as percentage of cells in each cell cycle phase. (E) Frequency of immune cell groups out of the CD45+ population. (F) Representation of the frequency of immune cell groups after cluster analysis of cell surface markers using the Phenograph algorithm (FlowJo); charts indicative of all mice. (G) SPION-CCPM fluorescence signal intensity (MFI) in immune cell groups of SPION-CCPM mice. (H) Percentage of CD3+CD8+ T cells. *p < 0.05, **p < 0.005, Mann–Whitney test (B, C), two-way ANOVA (D, E), or unpaired t-test (H). PBS (n = 8 mice, except B, n = 5) and SPION-CCPM (n = 3 mice, except B and C, n = 4).

