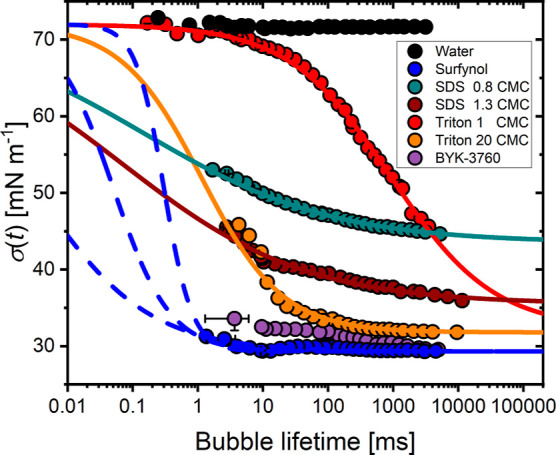
Figure 2.

Dynamic surface tension for water and all surfactant solutions used in this work. Symbols indicate average data as measured by the maximum bubble-pressure tensiometer, for which error bars represent either 3 times the standard deviation or the largest difference observed by varying the critical point. Lines represent eq 2 applied to the data, either by a least-squares fit to the rapid fall region via eq 3 (solid lines) or manual fitting (dashed lines).
