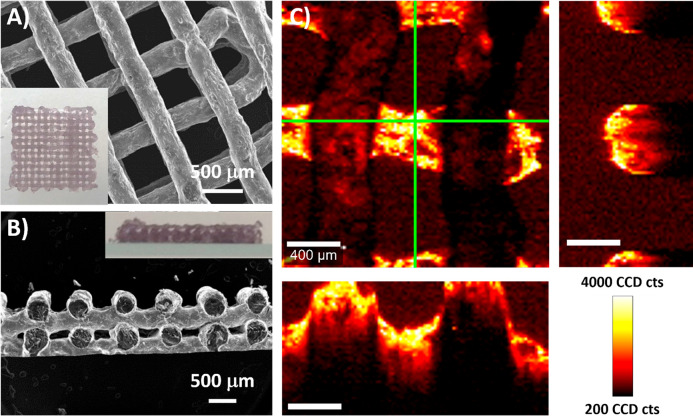
Figure 1.
(A) SEM image showing a top view 3D-printed scaffold (1 cm × 1 cm). A top-view photograph is shown as an inset. (B) SEM image showing a cross-section of the scaffold. A side-view photograph is shown as an inset. (C) SERS maps based on the intensity of the MBA peak at 1084 cm–1, showing details of the XY plane (focused on the second layer of the scaffold) and corresponding XZ and YZ planes, defined by green lines (scale bars: 400 μm).

