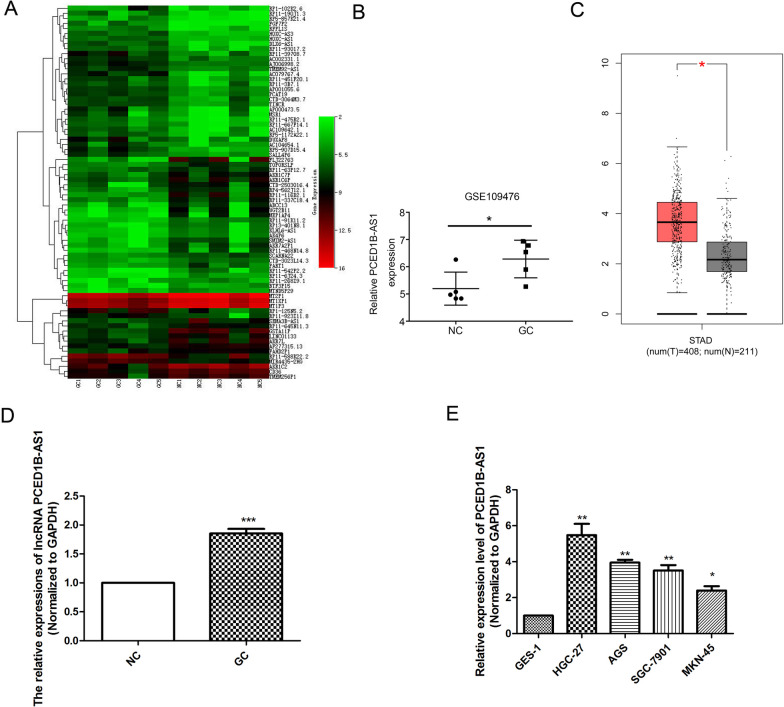
Fig. 1.
PCED1B-AS1 was overexpressed in gastric cancer tissues. A Heat map showed lncRNA expression levels in tumor tissue and its paired normal tissue. B Genotype-Tissue Expression (GTEx) data predicted the mRNA expression of PCED1B-AS1 in tumor tissue and its paired normal tissue (n = 5). C TCGA database predicted the expression level of PCED1B-AS1 in tumor tissues (n = 408) and normal tissues (n = 211). D RT-qPCR analysis was used to detect the expressions of lncRNA PCED1B-AS1 in the tissues of patients (n = 10). E RT-qPCR analysis was used to detect the levels of PCED1B-AS1 in the gastric cancer cells. The data were presented as mean ± SEM. versus NC/GES-1 group, *P < 0.05, **P < 0.01, ***P < 0.001

