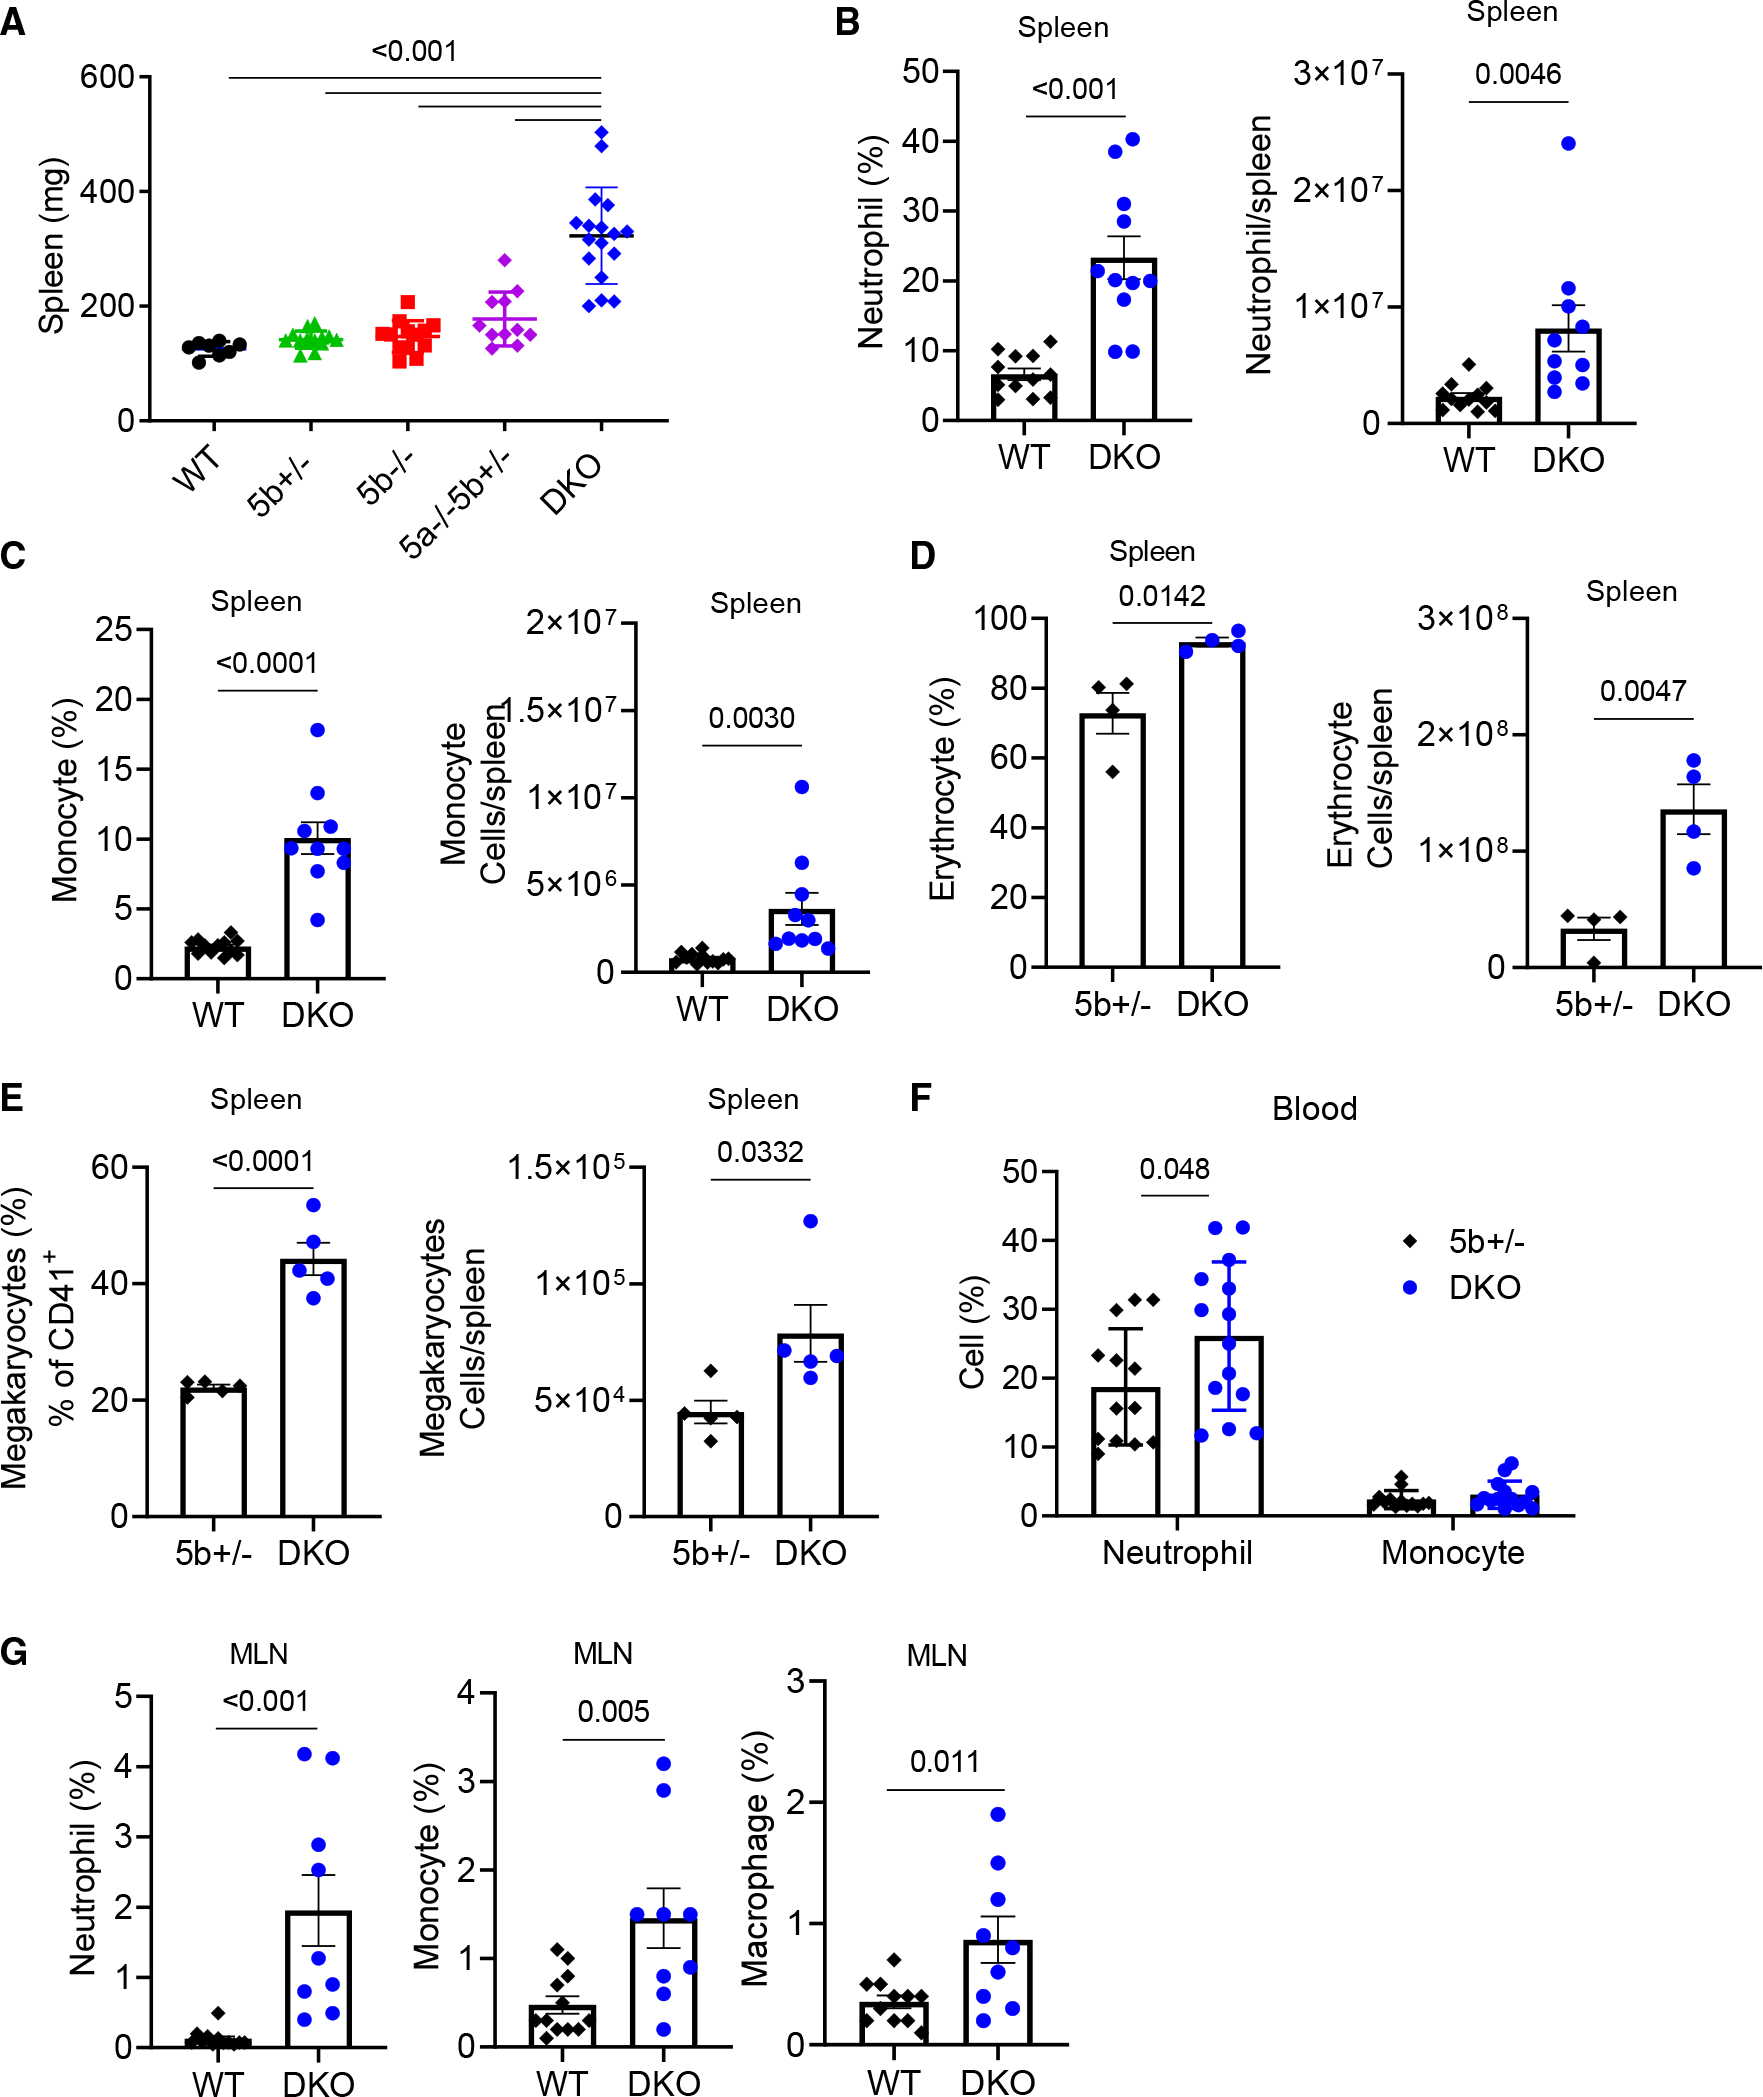
Figure 3. Colitic Wnt5 DKO mice develop splenomegaly.

Mice were treated as in Figure 1, and samples were collected on day 7 of DSS treatment.
(A) Spleen weight is shown.
(B and C) The percentages of neutrophils and monocytes in the CD45+ population and their absolute numbers were determined by flow cytometry.
(D) The percentages of erythrocytes in the CD45− population and their absolute numbers were determined by flow cytometry.
(E) The percentages of megakaryocytes in the CD45−CD150+CD41+ population and their absolute numbers were determined by flow cytometry.
(F and G) The percentages of neutrophils, monocytes, and macrophages in the CD45+ population were determined by flow cytometry.
Data are presented as means ± SEM with p value (two-tailed one-way ANOVA for A; two-tailed Student’s t test for B–G). Each datum point represents one mouse. Each independent experiment consists of at least three technical replicates.
See also Figure S3.
