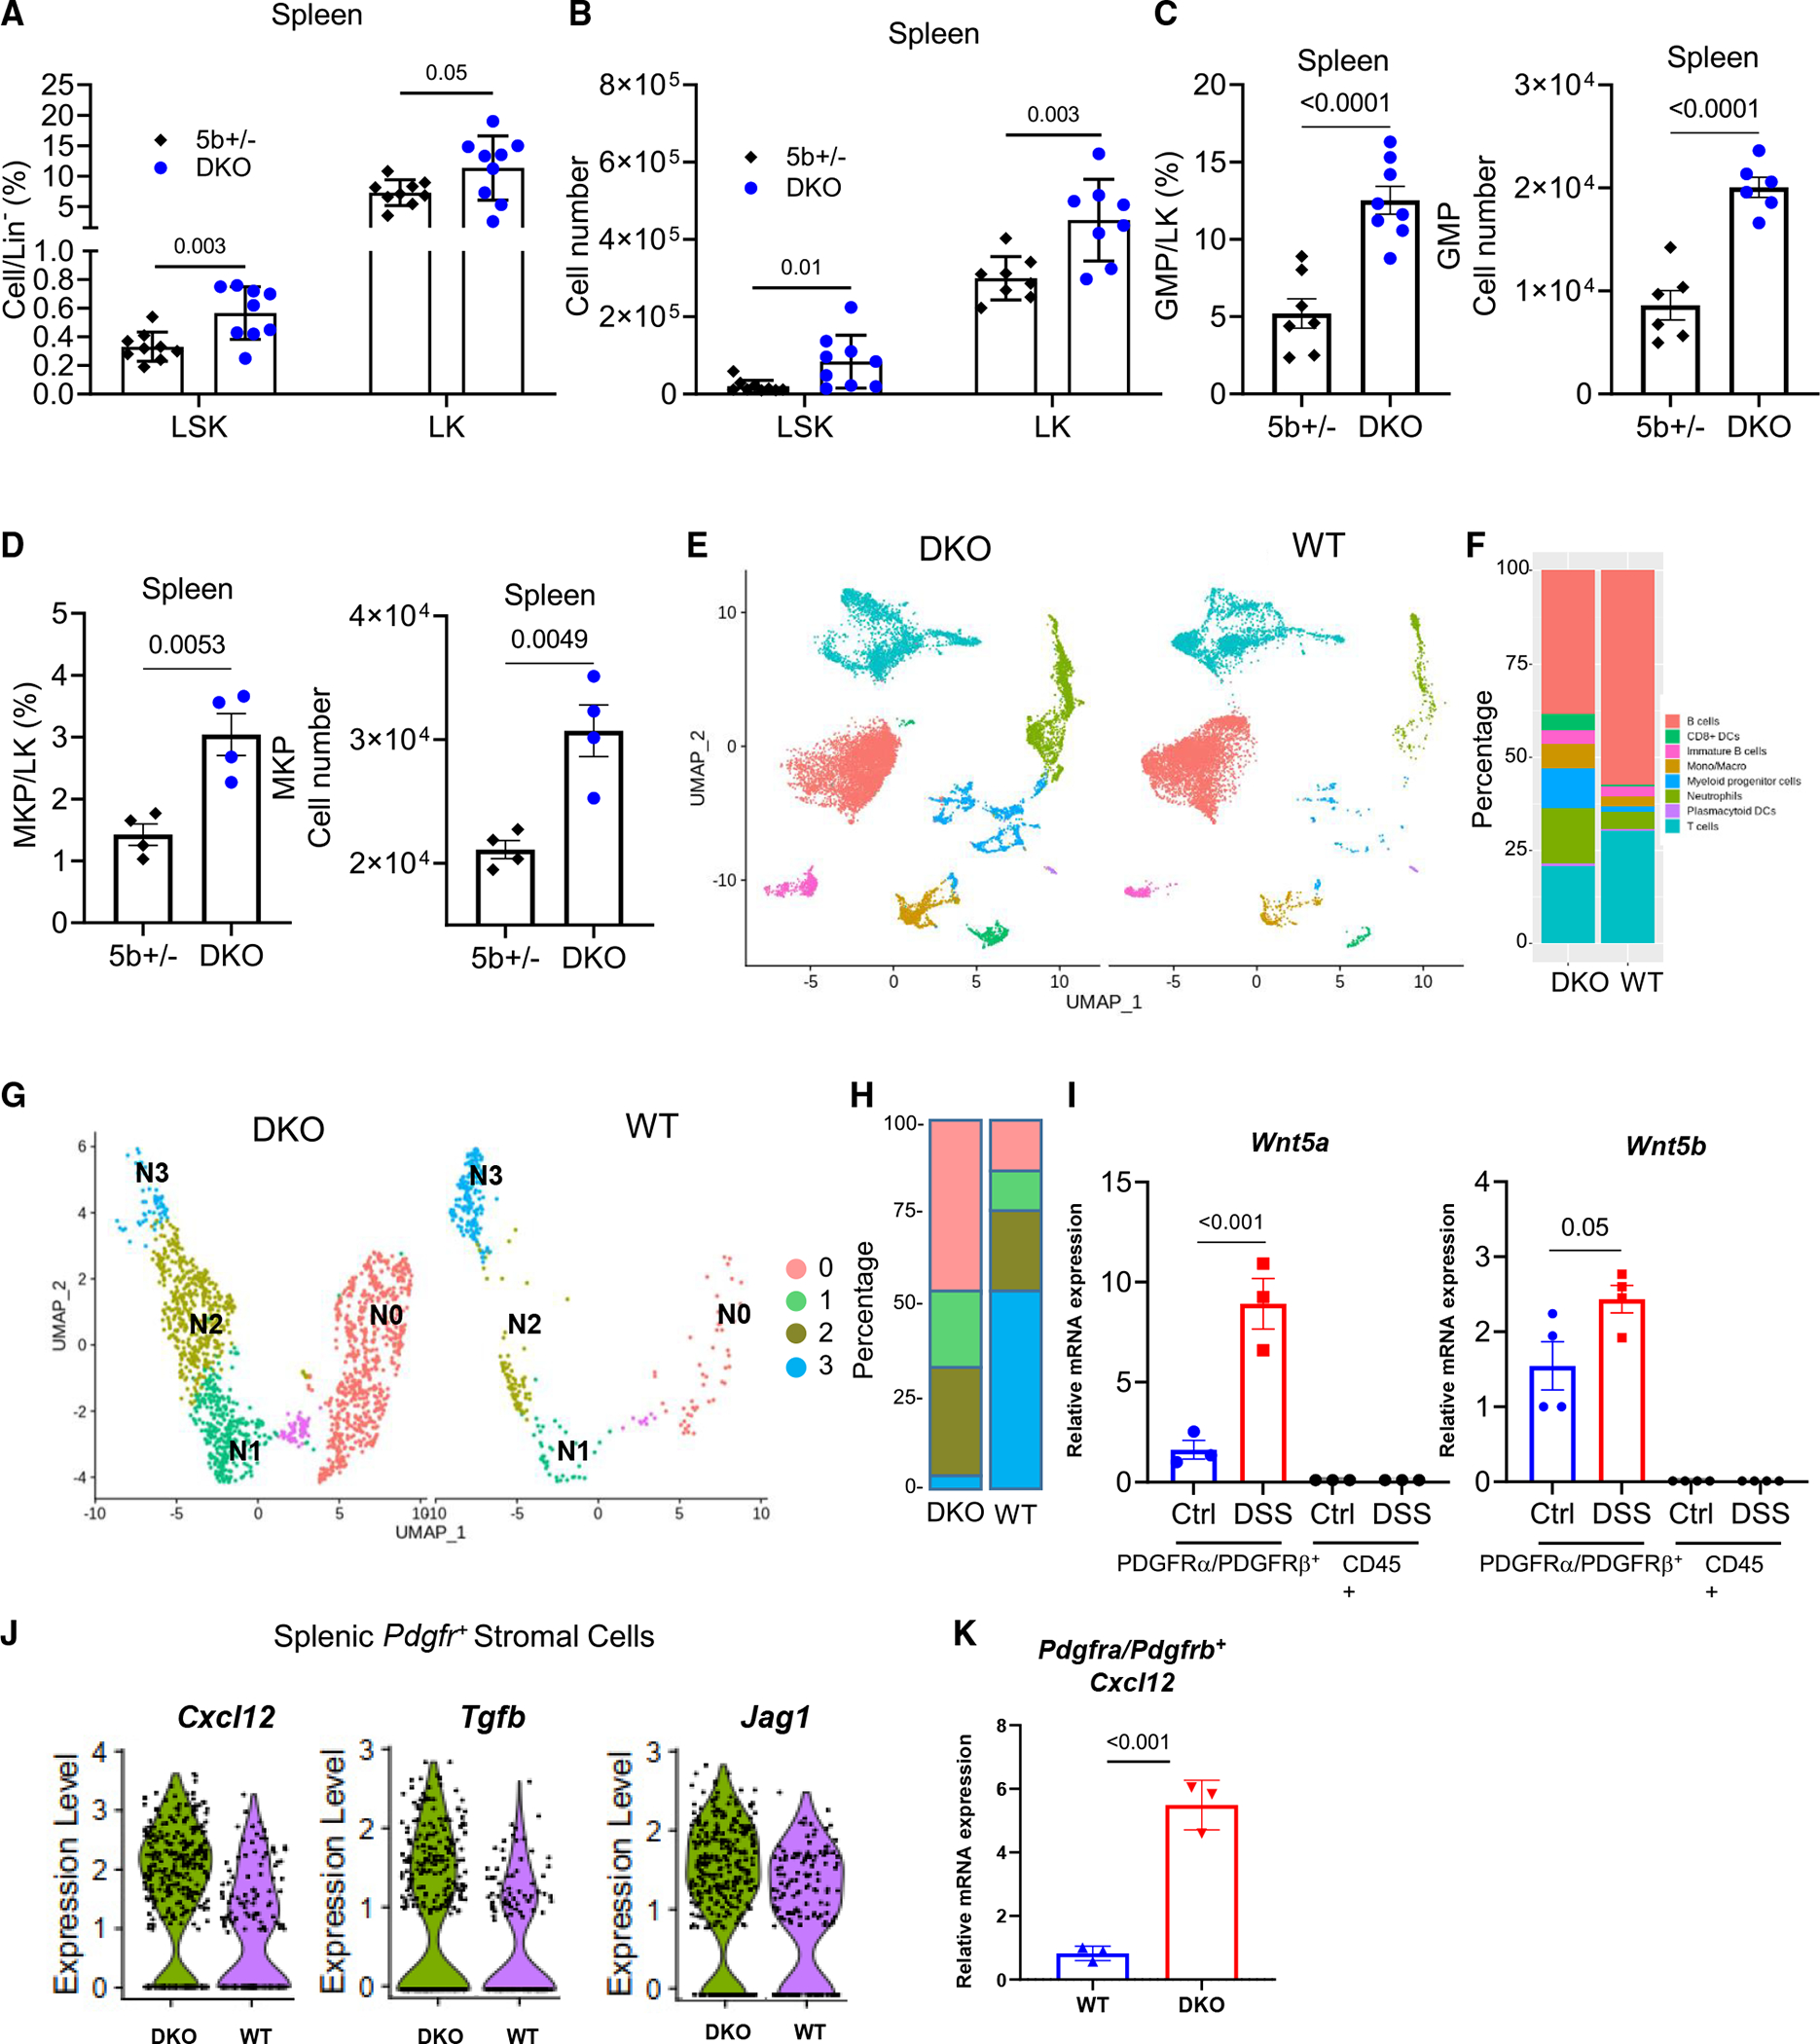
Figure 4. Wnt5 DKO mice enhance splenic extramedullary hematopoiesis upon colitis induction.

(A–F) DKO mice and WT control mice were treated as Figure 1. The percentages of LK and LSK cells in Lineage− and their absolute numbers were determined by flow cytometry (A and B). The percentages of GMPs and MKPs in LK and their absolute numbers were determined by flow cytometry (C and D).
(E) Uniform maniform approximation and projection (UMAP) plots of splenic CD45+ cells from DSS-treated Wnt5 DKO mice and WT mice.
(F) Percentages of the major cell types identified in (E).
(G) UMAP plots of the subclusters of cells expressing Ly6g+, S100a8+, and/or Cxcr2+ neutrophil markers from DSS-treated Wnt5 DKO mice and WT mice.
(H) Percentages of the subclusters identified in (G).
(I) WT mice were treated with normal water or DSS water for 7 days, and Wnt5a and Wnt5b mRNA expressions were determined by RT-qPCR in splenic CD45+ cells and CD45PDGFRα+PDGFRβ+ cells.
(J) WT mice and Wnt5 DKO mice were treated as in Figure 1. Spleen CD45− cells were collected and subjected to single-cell RNA sequencing (scRNA-seq). Expressions of Cxcl12, Jag1, and Tgfb in the PDGFRα/PDGFRβ+ cells of WT mice and DKO mice are shown in (J).
(K) WT and Wnt5 DKO mice were treated as in Figure 1. Spleen CD45−PDGFRα+PDGFRβ+ cells were collected, and Cxcl12 mRNA expression was detected. Results in (A)–(D), (I), and (K) are shown as means ± SEM with p values (two-tailed Student’s t test). Each datum point represents one mouse. Each independent experiment consists of at least three technical replicates.
