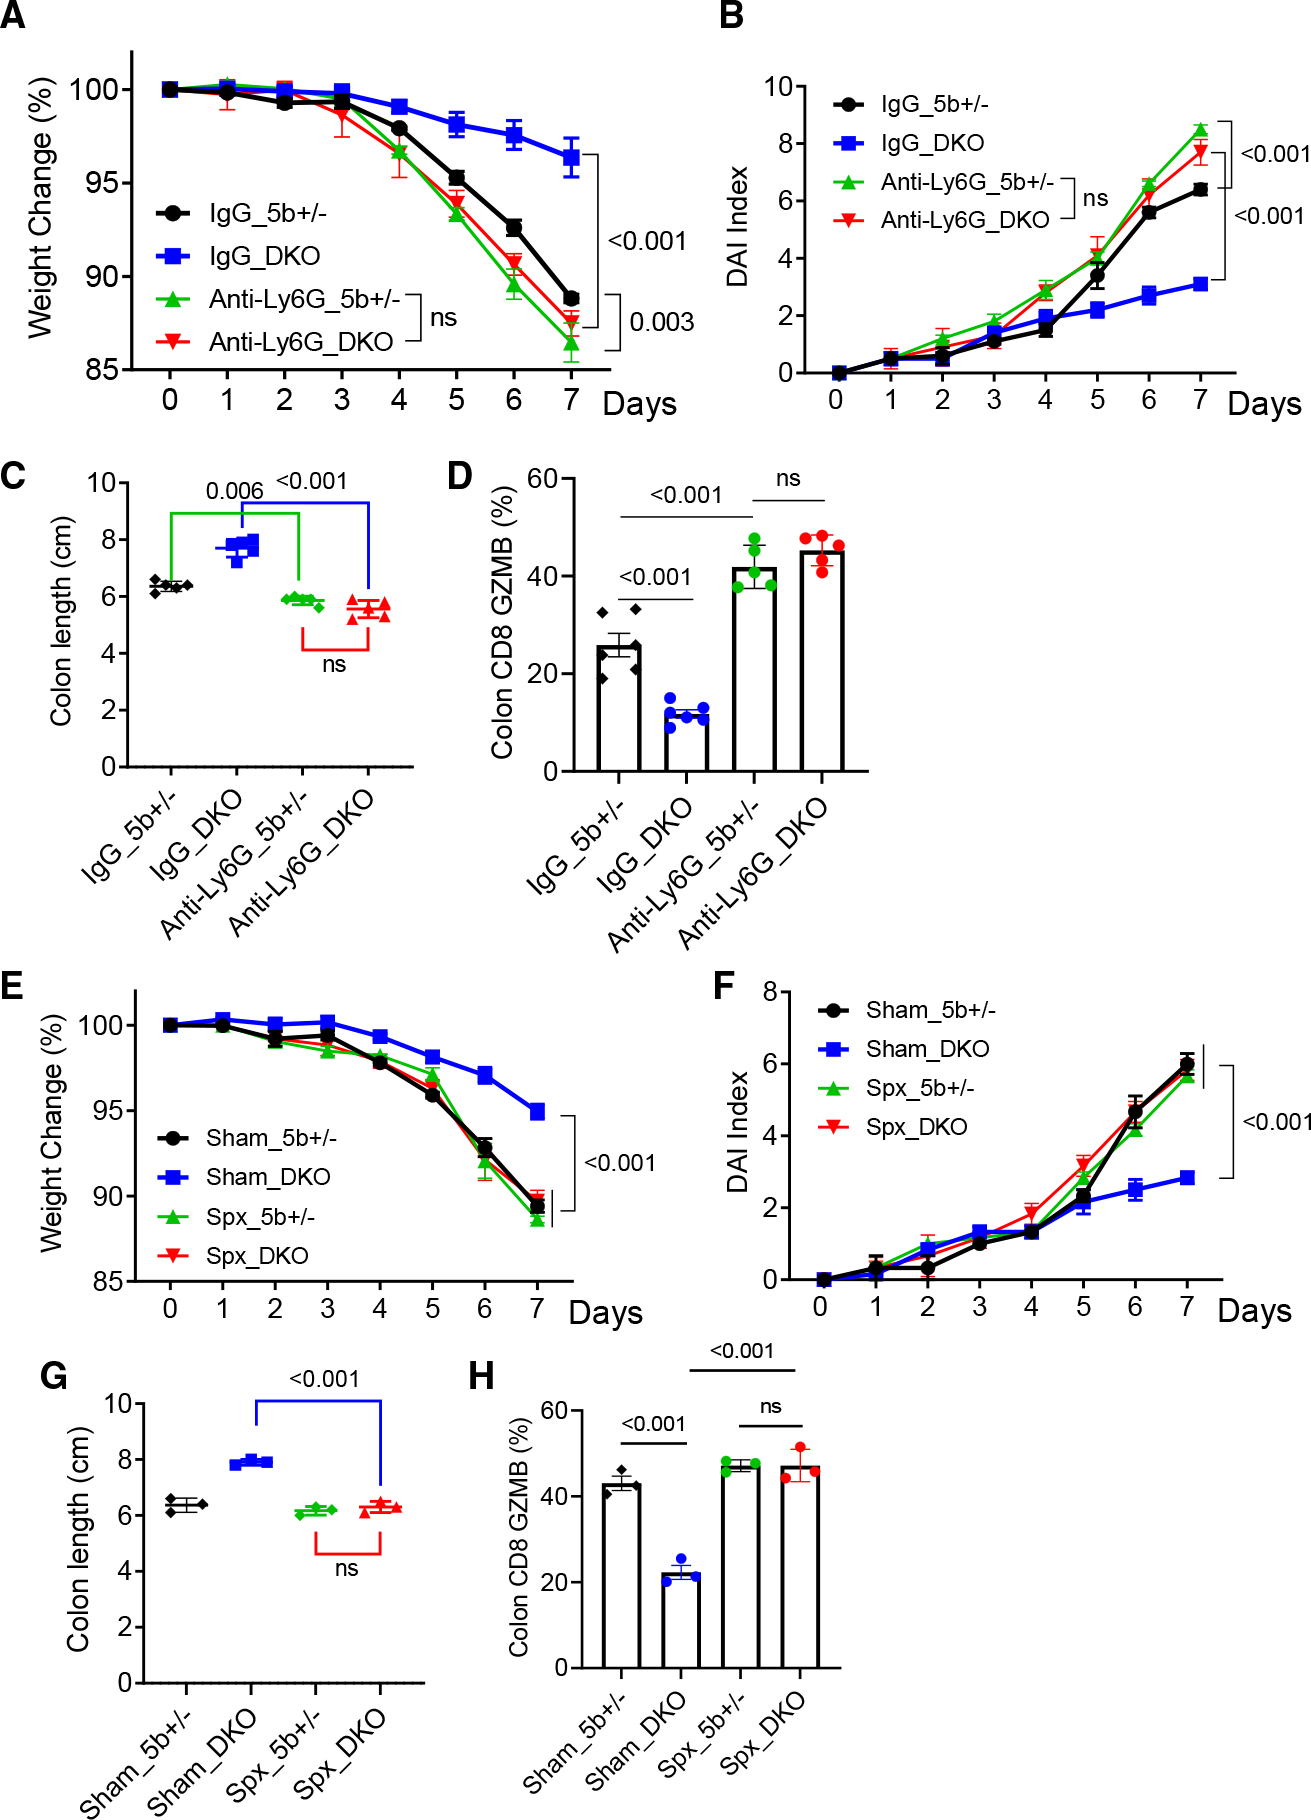
Figure 5. Colitic phenotypes of Wnt5 DKO mice depend on splenic neutrophils.

(A–D) Wnt5 DKO mice and the control mice were treated with DSS and subjected to neutrophil depletion as shown in Figure S5A (n = 5). Colitic phenotypes are shown in (A)–(C), and the percentages of GZMB+ in colon CD8+ T cells were determined by flow cytometry (D).
(E–H) Wnt5 DKO mice and the control mice were subjected to splenectomy before being treated with DSS (n = 3). Colitic phenotypes are shown in (E)–(G). Percentages of GZMB+ in colon CD8+ T cells were determined by flow cytometry (H).
Data are presented as means ± SEM with p values (two-tailed two-way ANOVA). Each datum point in (C), (D), (G), and (H) represents one mouse. Each independent experiment consists of at least three technical replicates.
See also Figure S5.
