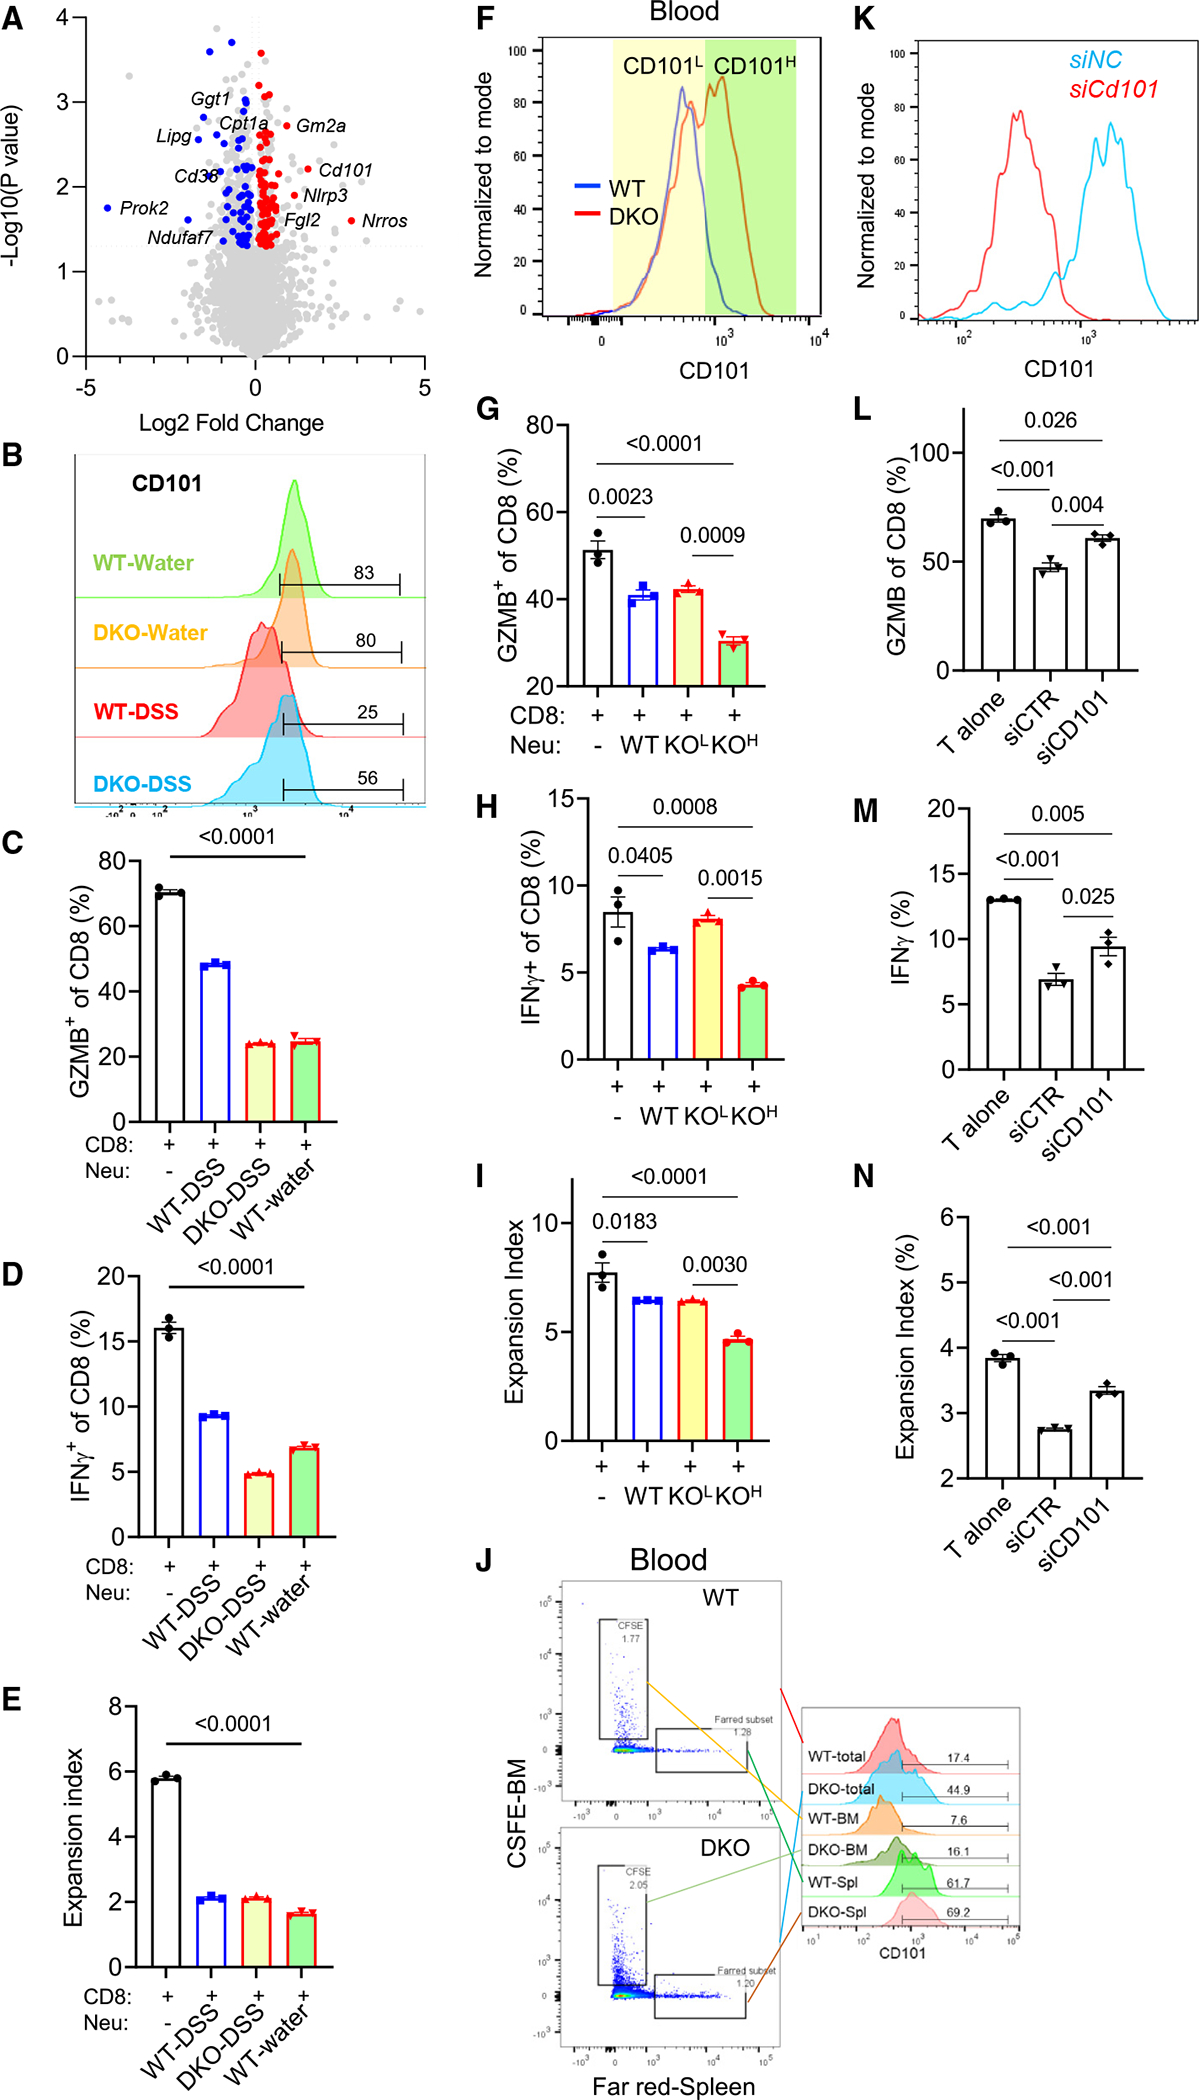
Figure 6. Colitic Wnt5 DKO mice produce CD101-high hyper-immunosuppressive neutrophils from the spleen.

DKO mice and WT control mice were treated as in Figure 1.
(A) Common upregulated (red) and downregulated (blue) genes (log2 fold change > 0.1 or < −0.1, adjusted p value [p value adj] < 0.05) from transcriptomic and proteomic analyses of blood neutrophils from DKO mice and WT mice are denoted on the volcano plot.
(B) CD101 was detected by flow cytometry in blood neutrophils from DKO mice and WT control mice treated with water or DSS.
(C–E) CD8+ T cells were cocultured with blood neutrophils sorted from WT water, WT-DSS, and DKO-DSS mice for 72 h. GZMB, interferon γ (IFNγ), and T cell expansion were determined by flow cytometry.
(F–I) CD8+ T cells were cocultured with WT-DSS blood neutrophils and DKO-DSS CD101-low and DKO-DSS CD101-high blood neutrophils, respectively, for 72 h. GZMB, IFNγ, and T cell expansion were determined by flow cytometry. Colored shades denote fluorescence-activated cell sorting (FACS) gating.
(J) CD101 expression was determined in blood Ly6G+CFSE+ and Ly6G+Far-Red+ cells by flow cytometry.
(K–N) Splenic neutrophils from WT-DSS mice and DKO-DSS mice were isolated by FACS and transfected with the Cd101 small interfering RNA (siRNA) for 48 h and then cocultured with CD8+ T cells for 72 h. The knockdown efficiency of Cd101 is shown in (K). GZMB, IFNγ, and T cell expansion were determined by flow cytometry.
Data in (C)–(E), (G)–(I) and (L)–(N) are presented as means ± SEM with p values (two-tailed one-way ANOVA), and each datum point represents one mouse. Each independent experiment consists of at least three technical replicates.
