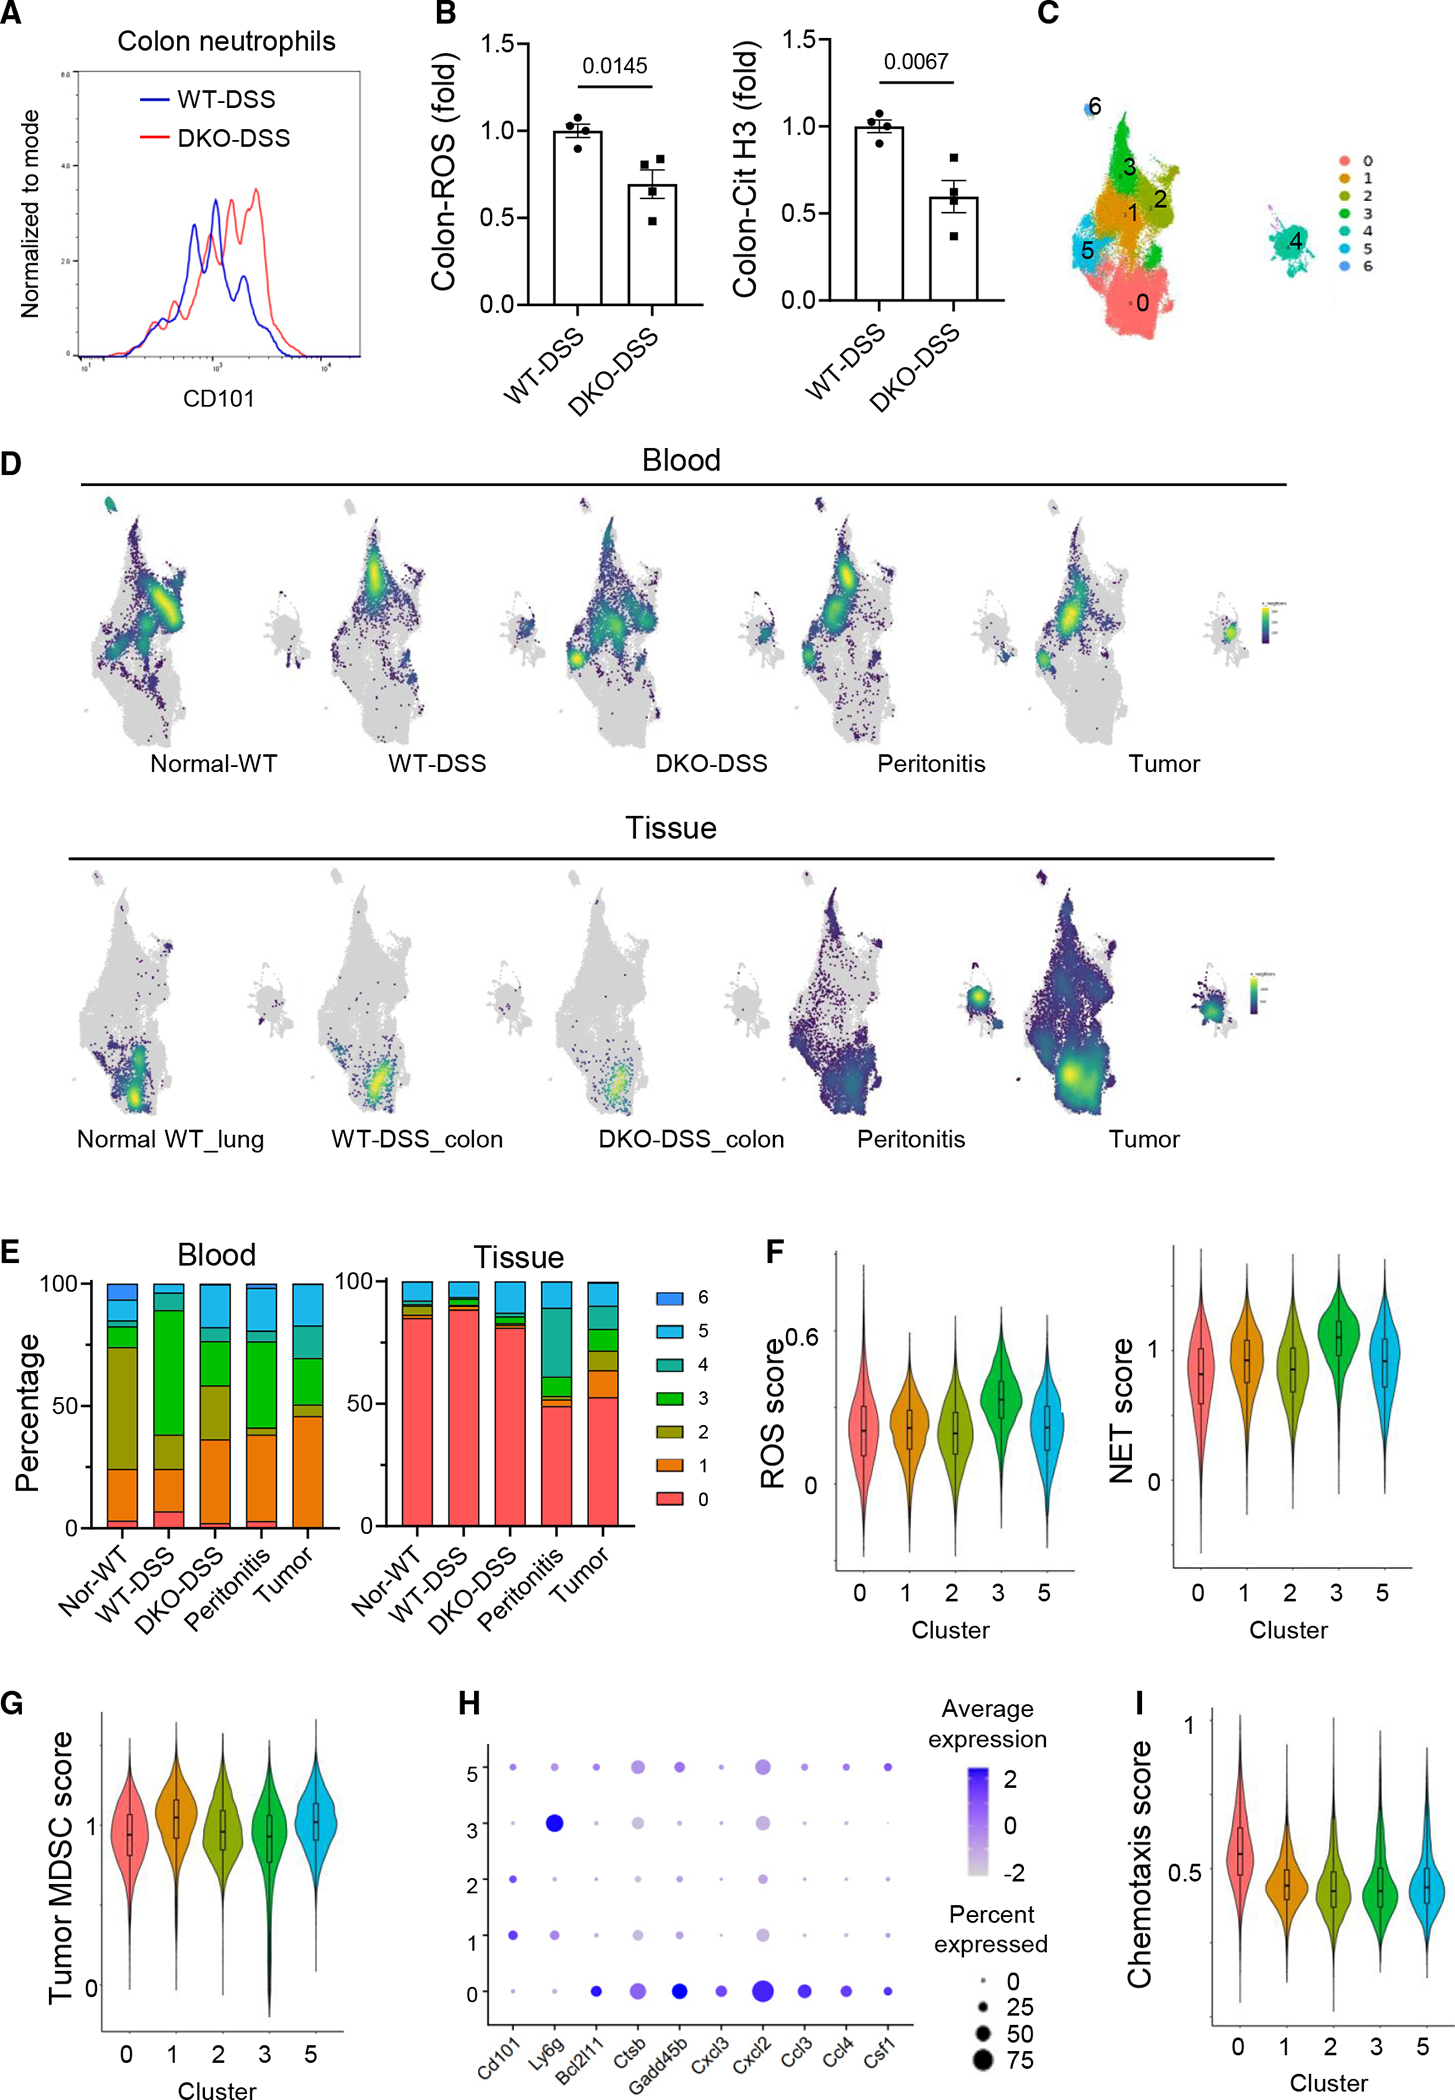
Figure 7. Transcriptomic profiles of blood neutrophils inform the functions of colon neutrophils.

(A) CD101 expression in the colon neutrophils of the WT-DSS mice and DKO-DSS mice was determined by flow cytometry.
(B) The ROS and citrullinated histone 3 (Cit-H3) contents in the colon neutrophils were determined by flow cytometry, and data are presented as means ± SEM with p values (two-tailed Student’s t test). Each datum point represents one mouse. Each independent experiment consists of at least three technical replicates.
(C) UMAP projection of subclusters of neutrophils aggregated from different scRNA-seq datasets.
(D) Point density-plot visualization of neutrophil distributions under different conditions. The color represents the density of overlapped neutrophils in local regions.
(E) Percentages of the subclusters under different conditions.
(F, G, and I) Violin plots of the ROS score, NET score, MDSC score, and chemotaxis score for the major subclusters.
(H) Expression of selected genes in the major subclusters.
