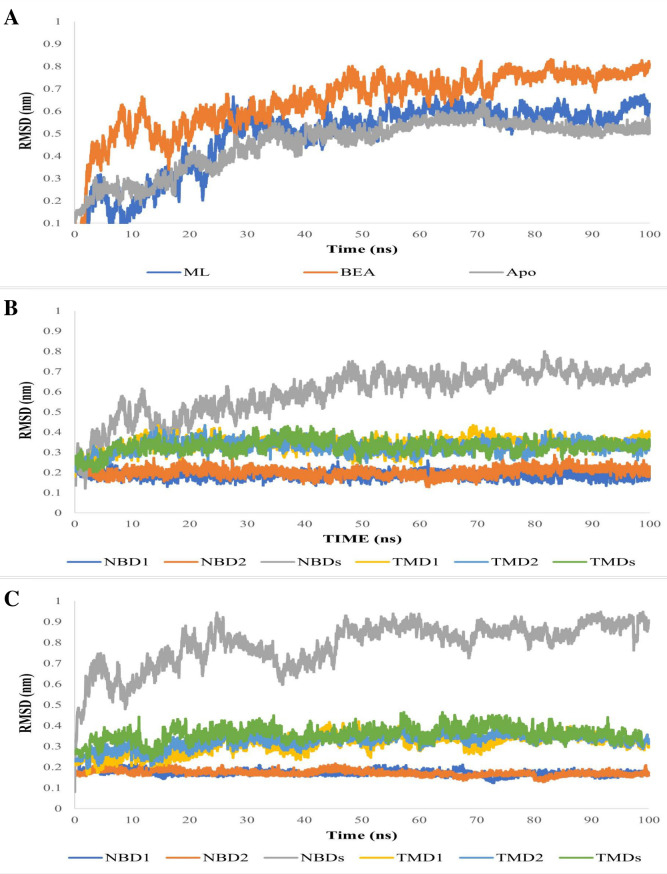
Fig 6.
(A) Plots of the Cα RMSDs of ABC transporter (apo and in complex with ML and BEA) overall structures during 100 ns of MD simulation period. (B) Plots of the Cα RMSDs of ABC transporter individual domains in complex with ML. (C) Plots of the Cα RMSDs of ABC transporter individual domains in complex with BEA.

