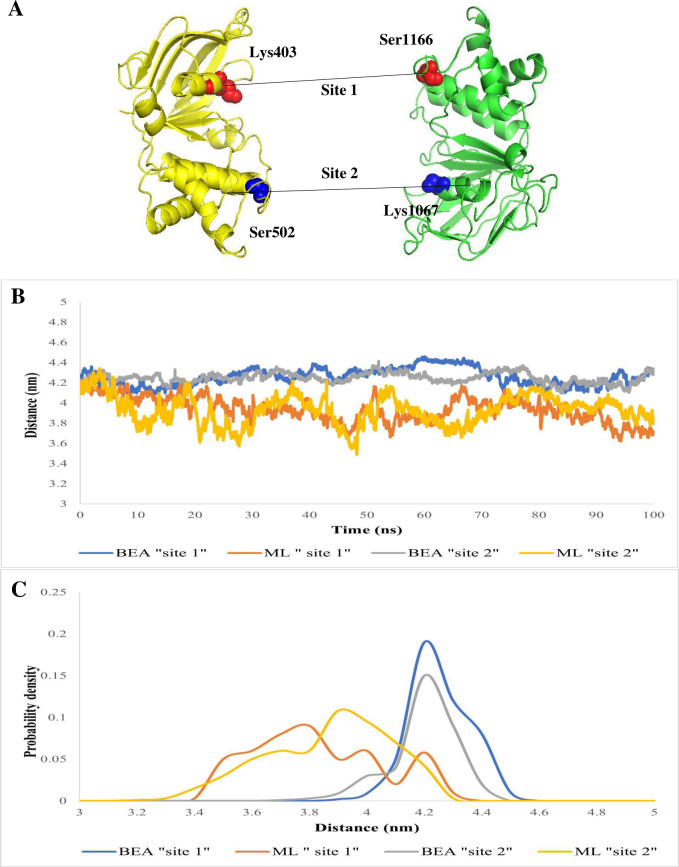
Fig 8.
(A) Cartoon representation of ABC transporter nucleotide-binding domain displaying the conserved residue pairs at the nucleotide-binding site. The Cα-Cα distance of “site 1” formed between the N-terminal walker A motif (Lys403) and the C-terminal signature sequence (Ser1166) is shown in red, while that of “site 2” formed between the C-terminal walker A motif (Lys1067) and the N-terminal signature sequence (Ser502) is shown in blue. (B) Time series of the distances between the conserved residues in sites 1 and 2. (C) Distance distributions of sites 1 and 2 in the ABC transporter in complex with ML and BEA. The distributions were calculated every 0.5 Å.

