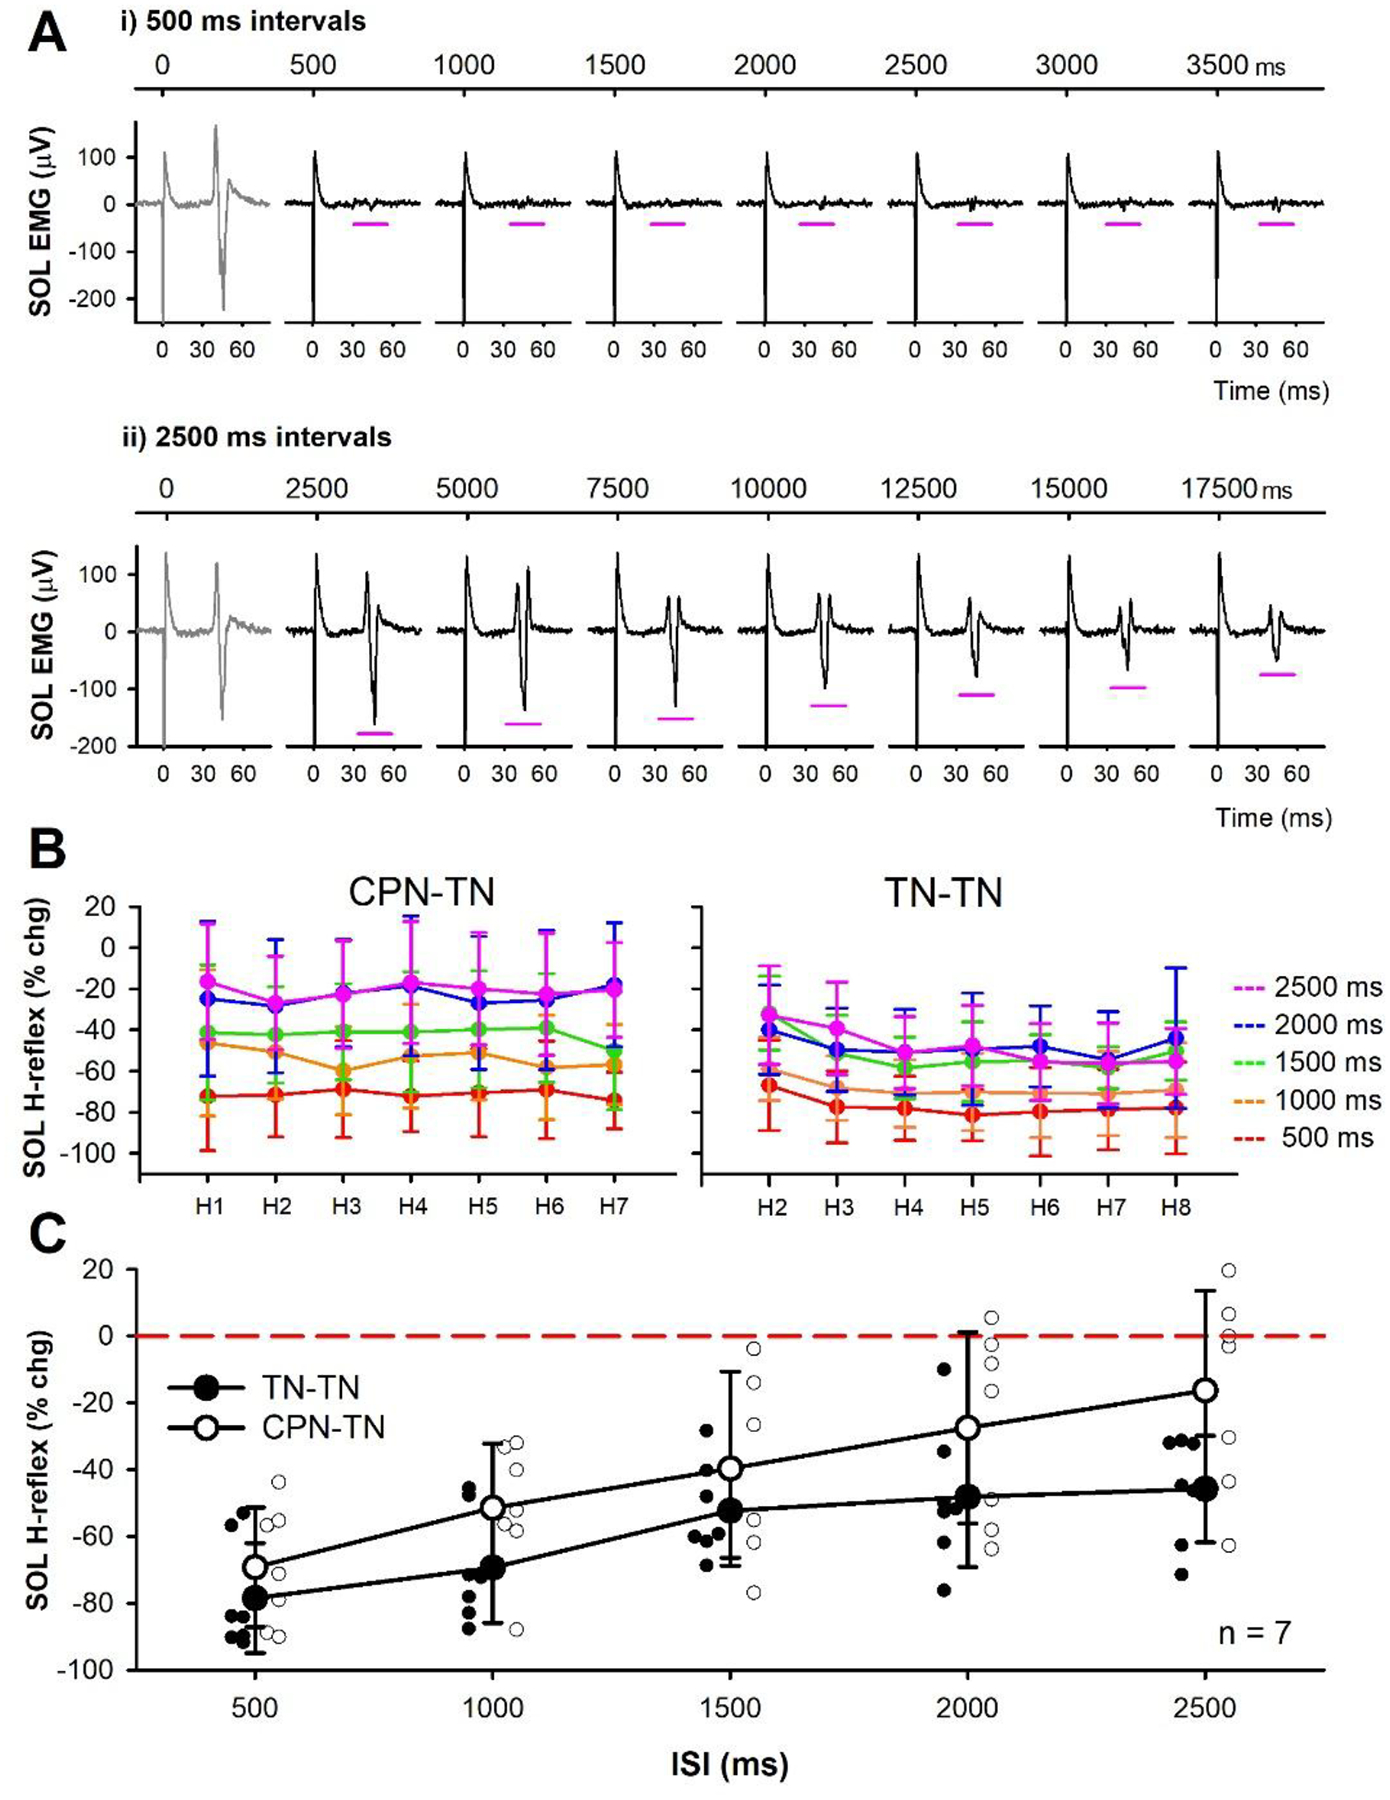
Figure 10: Post-activation depression of the soleus H-reflex.

A) Example rate-dependent depression (RDD) of unrectified soleus EMG evoked by repetitive TN stimulation every 500 ms (i) and 2500 ms (ii) in one participant measured at rest. Continuous time displayed in top trace to indicate when TN stimulation was applied (marked by large stimulation artifact) and expanded time scale in bottom to display the H-reflex occurring in the time window marked by the pink horizontal lines (time set to 0 ms when TN stimulation was applied). B) Change in H-reflexes as a % of the mean test (unconditioned) H-reflex (CPN-TN, left) or as a % of H1 (TN-TN) for each ISI averaged across the 7 participants. C) The mean % change of all conditioned H-reflexes (CPN-TN: H1 to H7, TN-TN: H2 to H8) in a given ISI trial averaged across the group for both the CPN-TN stimulation (large white circles) and the TN-TN stimulation (RDD, large black circles), not significantly different (F[1,4] = 1.860, P = 0.152, two-way RM ANOVA). Small white and black circles represent individual participant data for CPN-TN and TN-TN trials, respectively. Error bars ± SD.
