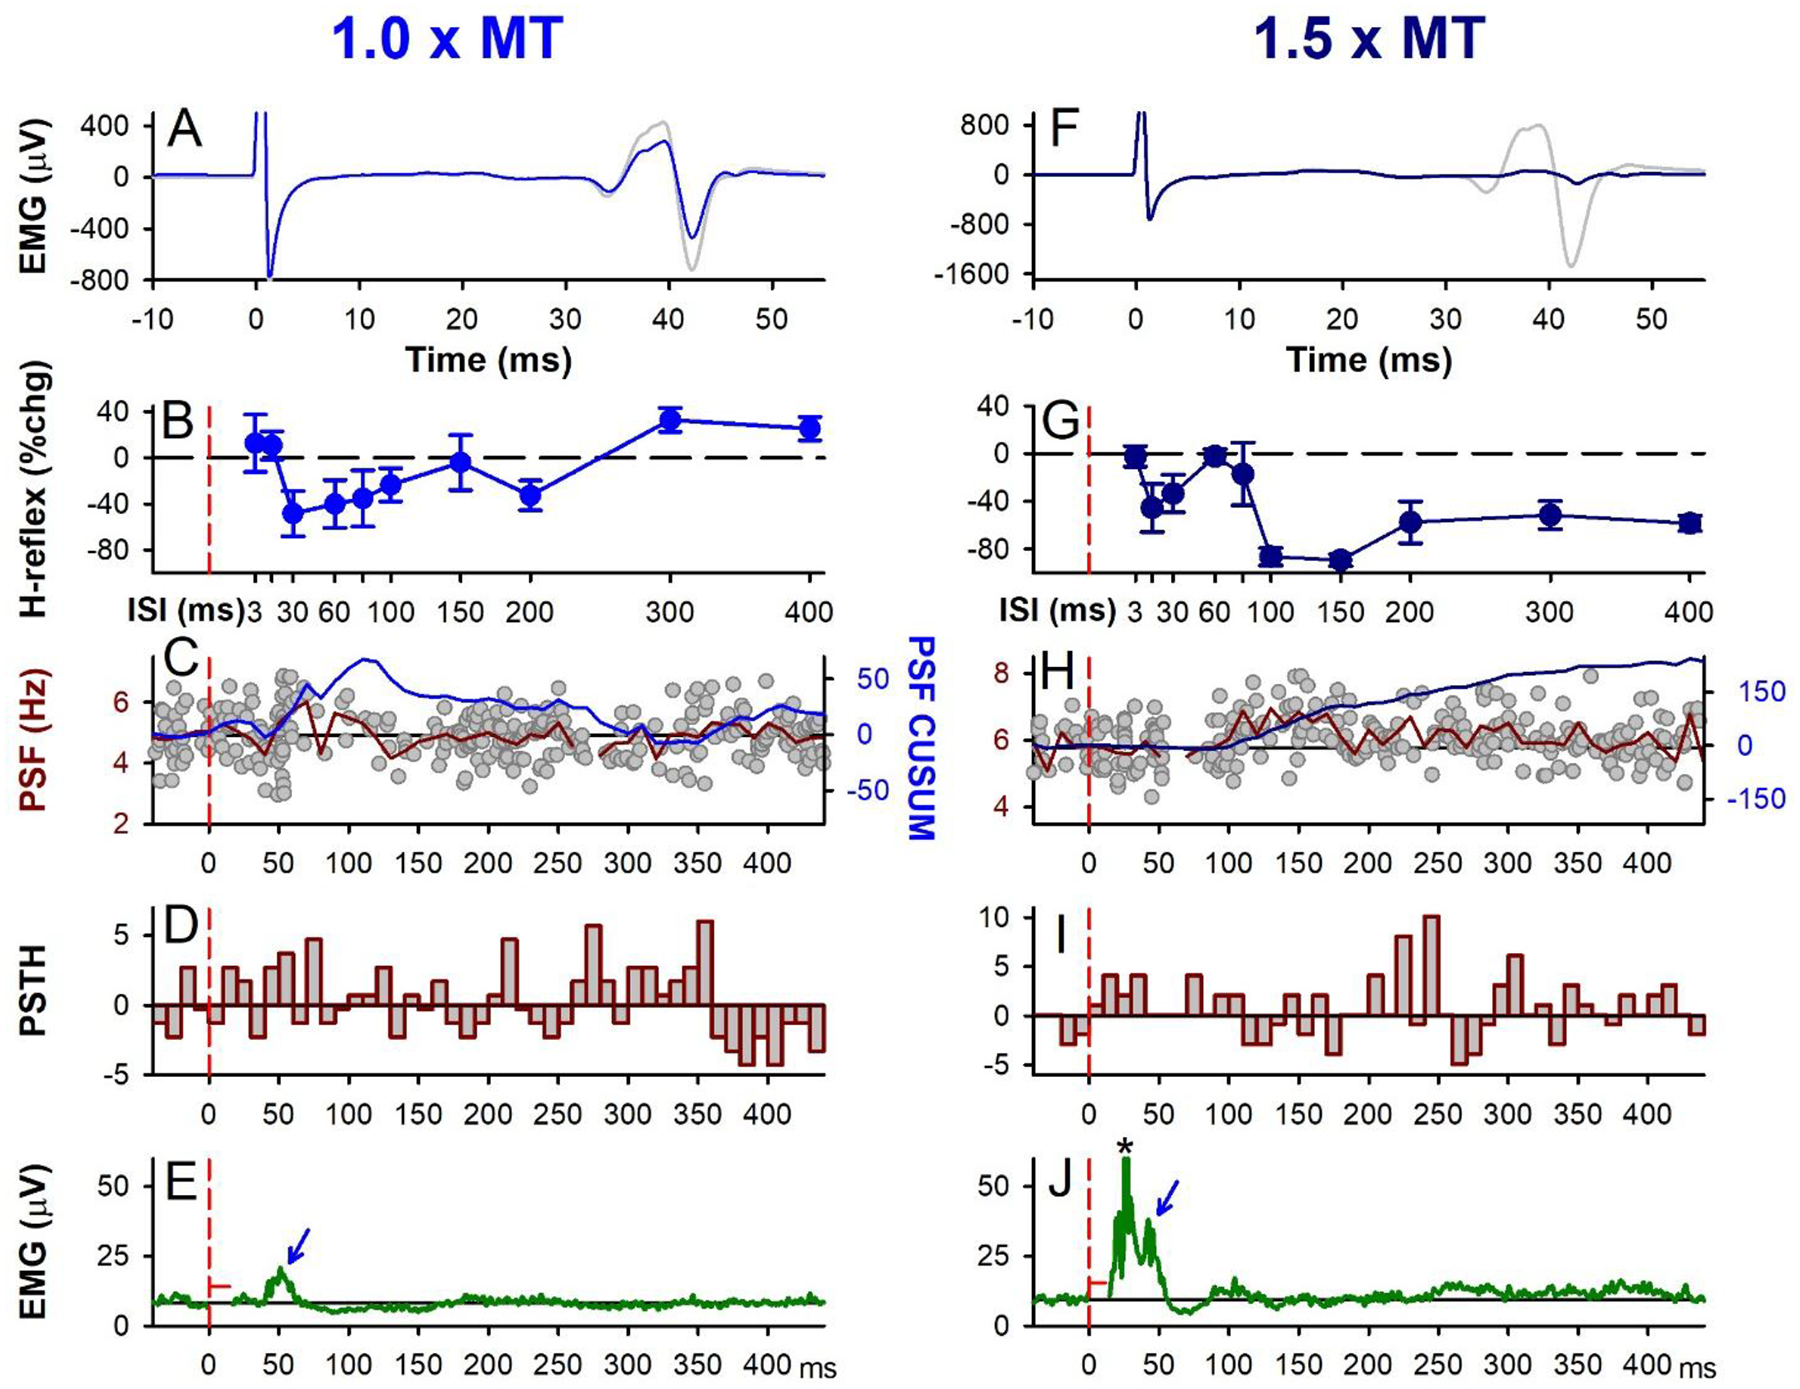
Figure 5: CPN stimulation: early H-reflex suppression.

Same presentation as Figure 1 but for 1.0 × MT (A-E) and 1.5 × MT (F-J) electrical CPN conditioning stimulation (3 pulses at 200 Hz), representative data from a single participant. A,F) Unrectified EMG of test (grey) and conditioned H-reflex (blue: 1.0 × MT at 30 ms ISI and dark blue: 1.5 × MT at 100 ms ISI) measured at rest. B,G) % change soleus H-reflex (Mean ± SD) plotted at each ISI tested. C,H) PSF (grey dots) with 108 sweeps in C and 98 sweeps in H, mean PSF (red line) measured from CPN stimulation alone during weak contraction (as in D-J) and CUSUM of mean PSF (blue line). D,I) Number of motor unit counts per 10-ms time bin with average pre-stimulation count subtracted. E,J) Average rectified soleus EMG with 131 sweeps in E and 100 sweeps in J. Stimulation artifact has been removed (horizontal red line near 0 ms). B-J) Vertical dashed red lines indicate the onset of the CPN conditioning stimulation train (at time 0). * in J marks crosstalk from TA M-wave.
