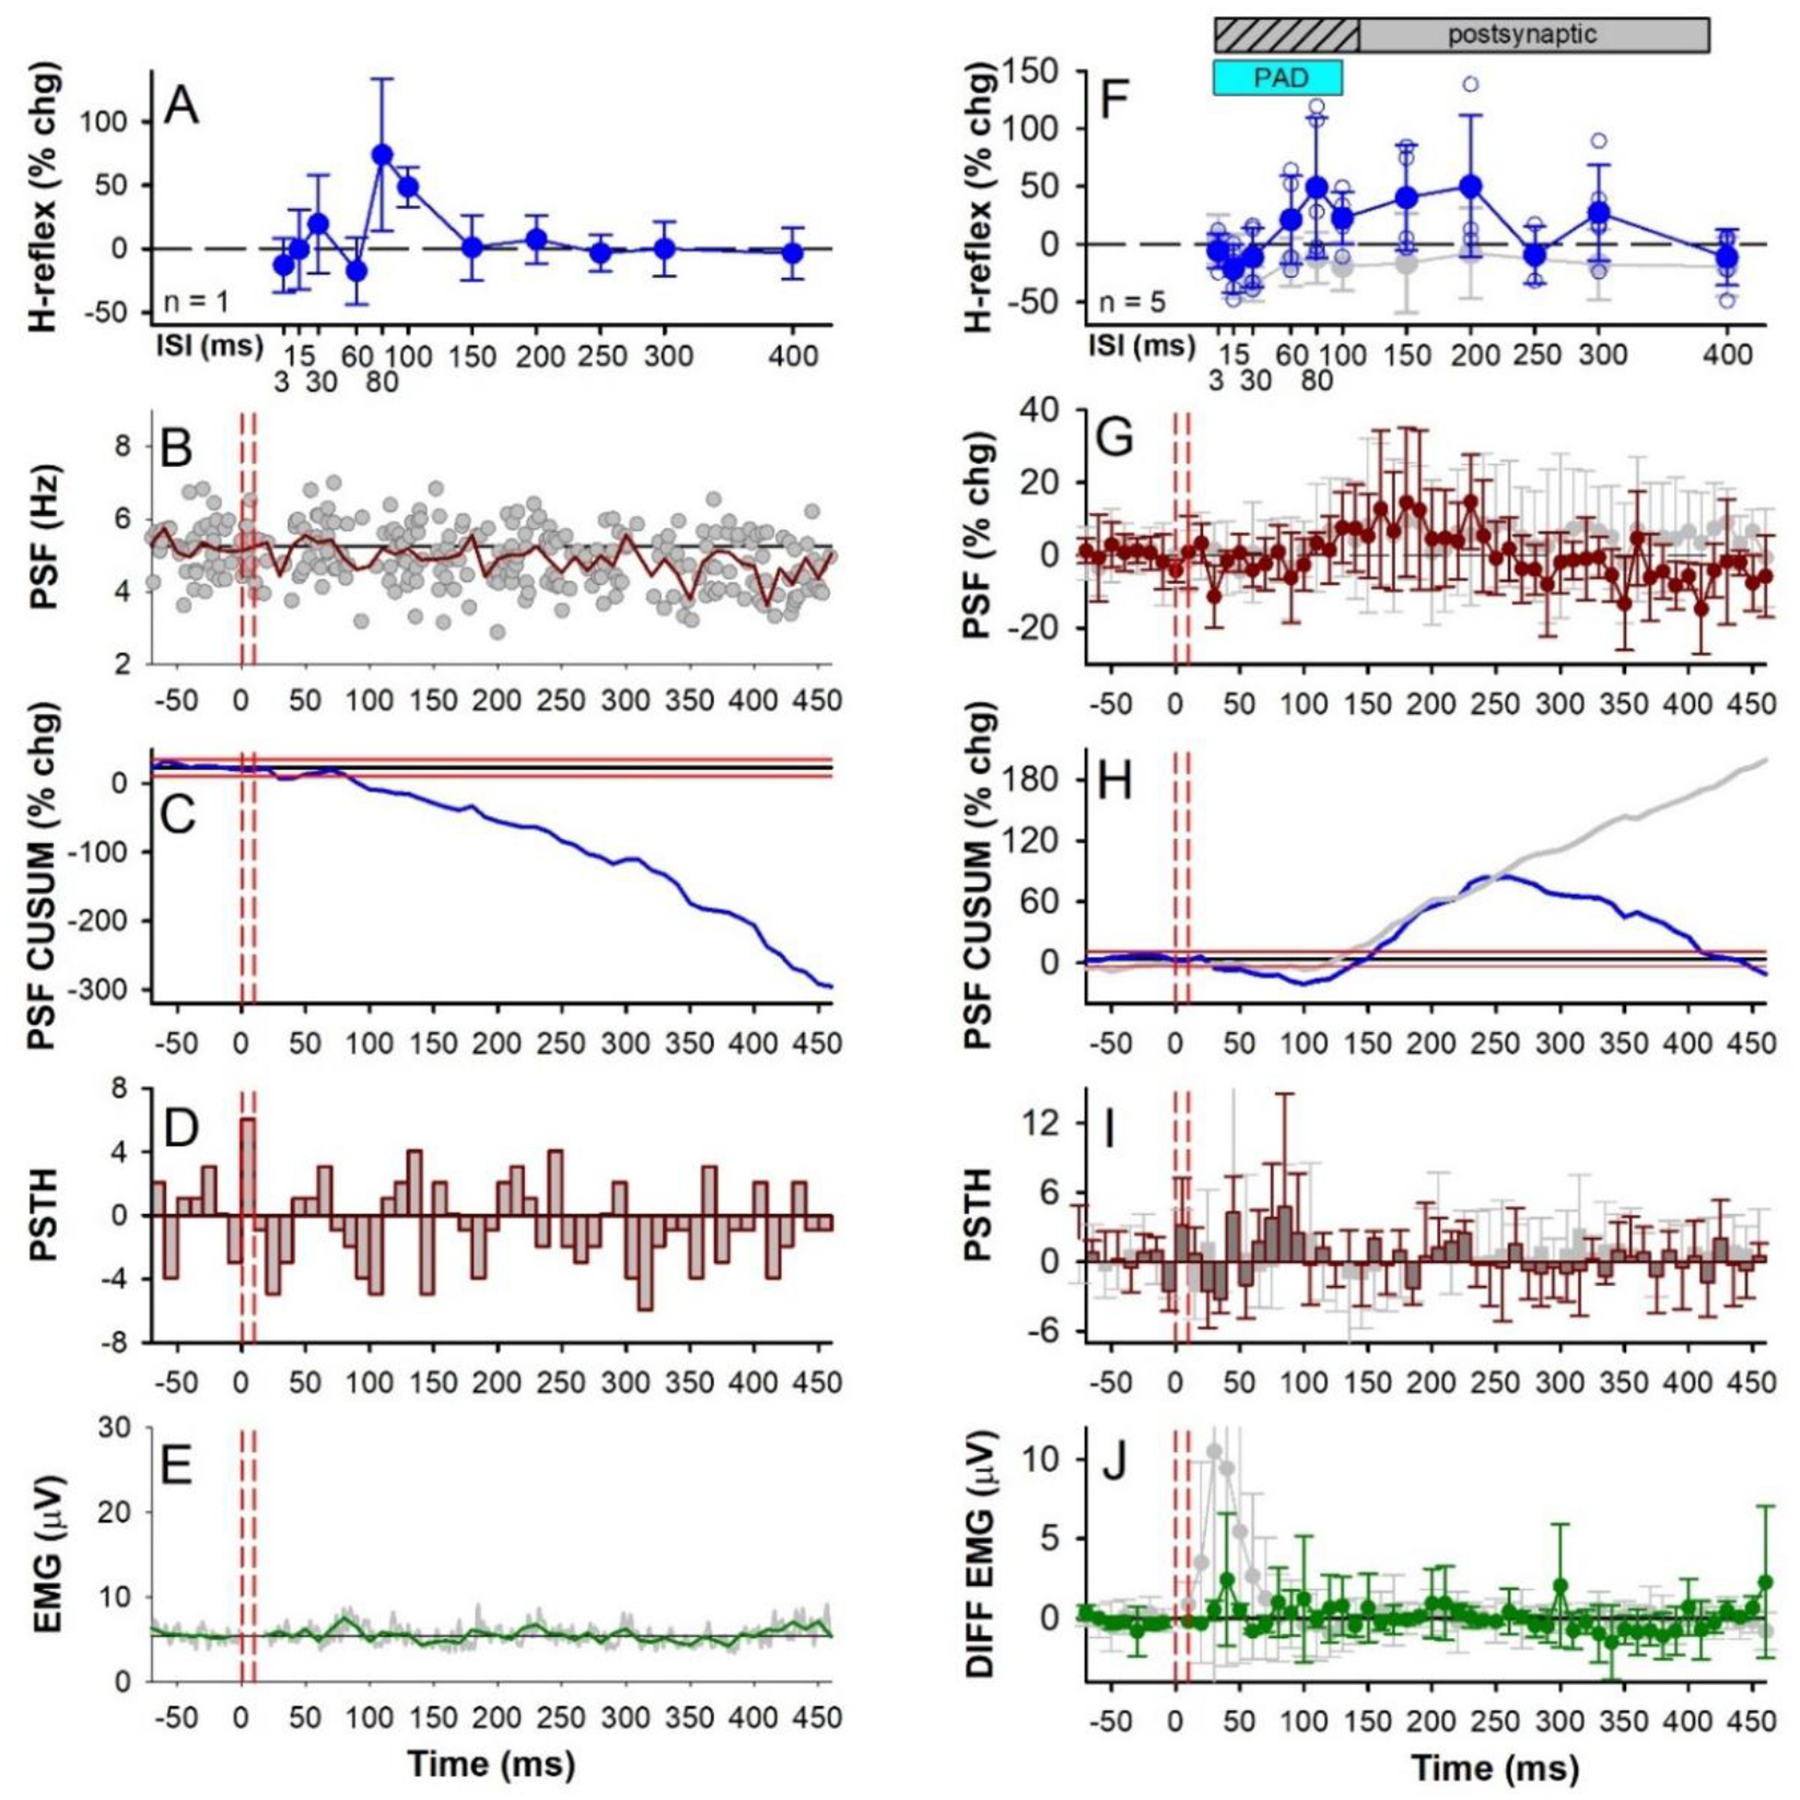
Figure 7: CPN stimulation: early H-reflex facilitation, individual and group data.

Similar presentation as Figure 6 but with 1.0 × MT CPN conditioning stimulation that did not evoke an early reflex response in the soleus muscle (3 pulses at 200 Hz). A-E data from an individual participant and F-J group data (n = 5 participants). Grey data points in F-J are replotted from Figs. 6A–E where 1.0 × MT CPN stimulation produced an early soleus reflex response. Note however the more compressed y-axis scales compared to Fig. 6 and the removal of the axis break in H. There was an effect of ISI on the % change H-reflex (F) (F[4,11] =2.113, P = 0.043) and an effect of time on the % change PSF (G) (F[3,61] = 1.673, P = 0.005) but no effect of time on the count per bin in the PSTH (I) (F[3,61] = 1.120, P = 0.281) or EMG (J) (F[3, 60] = 0.994, P = 0.498), all one-way RM ANOVAs. In each participant, an average of 1.70 (0.96) units (range 1–3) were used to construct the PSF that formed the group data in (G), with an average of 118.00 (44.64) sweeps (range 83–180), resulting in 7.00 (2.83) frequency points in each 10-ms bin (range 4.4–11.0), and with a pre-stimulus firing rate of 6.56 (1.54) Hz (range 5.31–8.75 Hz) having a firing rate coefficient of variation of 7.62 (1.22) (range 6.21–8.90). All H-reflexes measured at rest. Small open circles in F are individual participant data points. Error bars ± SD.
