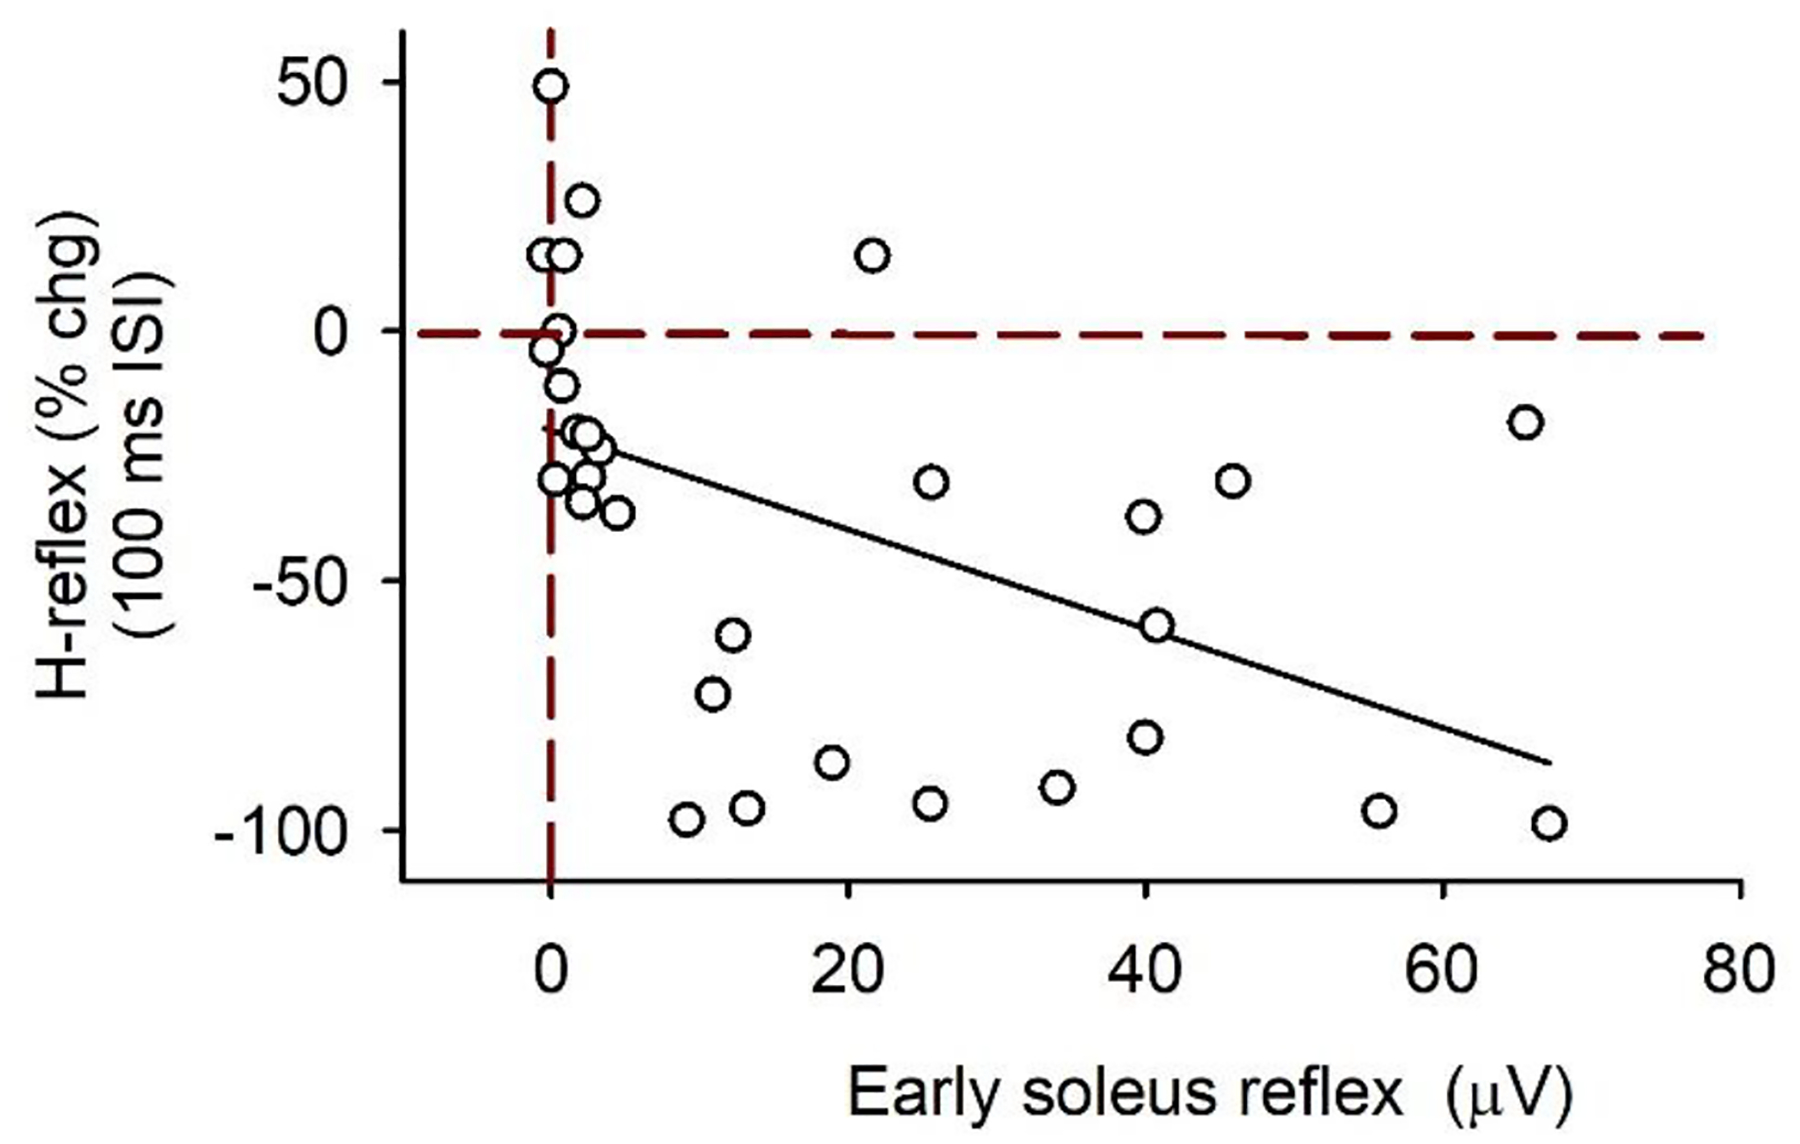
Figure 8: CPN stimulation: % change soleus H-reflex at the 100 ms ISI vs early soleus reflex EMG.

% change (chg) H-reflex at the 100 ms ISI plotted against the early soleus reflex (mean rectified EMG averaged over the 30–50 ms window after the CPN stimulation applied alone – the mean rectified pre-stimulus EMG) for both the 1.0 and 1.5 × MT CPN conditioning stimulation (3 pulses at 200 Hz) for participants with and without an early soleus reflex (n = 18). Data fitted to a linear line (slope = 1.0 % chg/mV). There was a significant correlation between the % chg H-reflex and the early soleus reflex (r = −0.50, P = 0.005, Pearson Product-Moment Correlation). There are 30 data points: typically 2 values from each participant (one from the 1.0 and 1.5 × MT trials each). In some recordings (n = 6), the TA M-wave obscured the early soleus reflex and this data was not used. Red vertical dashed line marks no change in the soleus EMG from the CPN stimulation above background. Red horizontal dashed line marks 0 % change in the conditioned soleus H-reflex at the 100 ms ISI.
