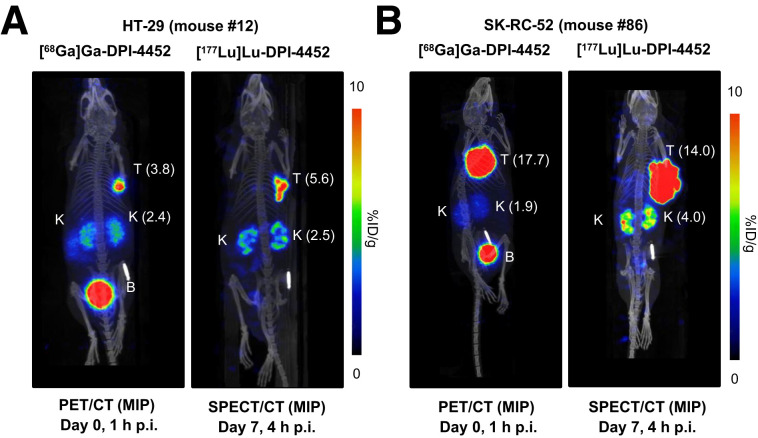
FIGURE 2.
[68Ga]Ga-DPI-4452 and [177Lu]Lu-DPI-4452 biodistribution in mice with HT-29 and SK-RC-52 xenografts. Shown are maximum-intensity projection (MIP) images of representative mice bearing subcutaneous xenografts of HT-29 (A) or SK-RC-52 (B) tumors. Each mouse was imaged by PET/CT at 1 h after injection (p.i.) with 9 MBq of [68Ga]Ga-DPI-4452 per animal (left) and, 7 d later, by SPECT/CT at 4 h after injection with 33 MBq of [177Lu]Lu-DPI-4452 per animal (right). Scale bar represents radioactivity concentration as percentage injected dose per gram of tissue (%ID/g) (values in parentheses). B = bladder; K = kidney; T = tumor.

