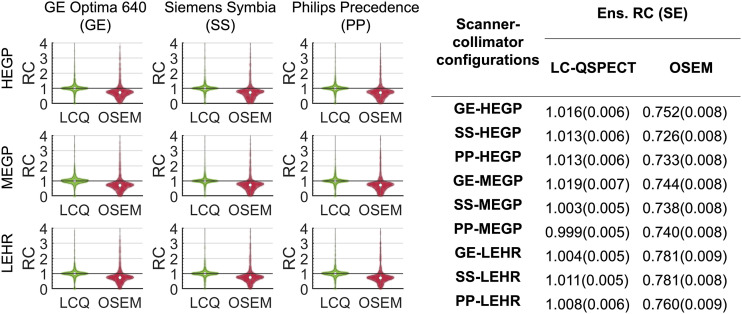
FIGURE 5.
Violin plots of and ensemble-averaged RCs for estimated doses of all 2,903 lesions in trial cohort, obtained using LC-QSPECT and OSEM methods, with 9 SPECT scanner–collimator configurations. SE of each ensemble-averaged (Ens.) RC is also presented. HEGP = high-energy general-purpose; LCQ = LC-QSPECT; LEHR = low-energy high-resolution; MEGP = medium-energy general-purpose.

