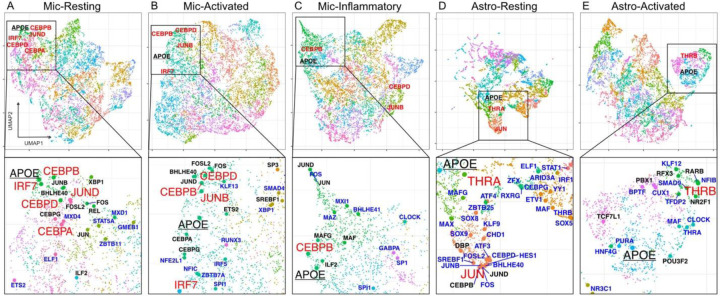
Figure 3.
UMAP representation of gene regulatory networks
A-E) A global UMAP visualization of each cell states’ regulome along with a zoomed view highlighting APOE. Principle component analysis was performed on the TF-by-target gene matrix. The top five principal components were used to calculate the UMAP coordinates. APOE is underlined. The TFs in red directly regulate APOE. TFs in black significantly upregulate the APOE gene cluster. TFs in blue are the TFs that were replicated in the ROSMAP dataset. D) The global UMAP for Astro-resting is zoomed. The full figure can be found in Supplementary Figure 3.

