Figure 6:

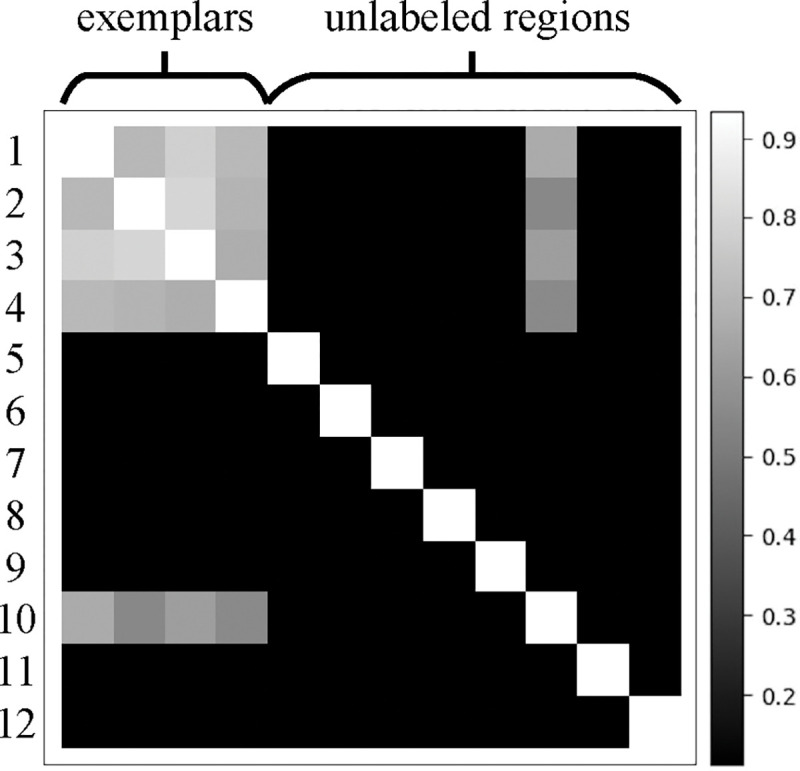
Cosine similarity matrix for 12 regions, comprising 4 exemplars (1–4) and 8 unlabeled regions (5–12). Entries at the intersection of row i and column j denote the cosine similarity between latent features of regions i and j.

Cosine similarity matrix for 12 regions, comprising 4 exemplars (1–4) and 8 unlabeled regions (5–12). Entries at the intersection of row i and column j denote the cosine similarity between latent features of regions i and j.