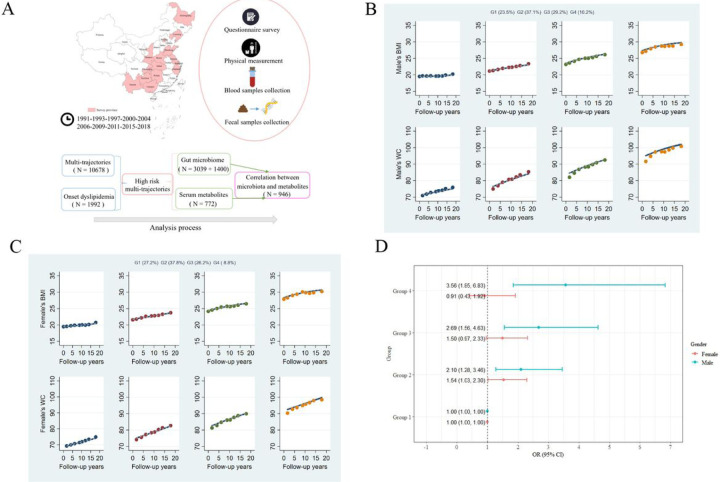
Figure 1. Multi-trajectories of BMI and WC and their associations with dyslipidemia.
(A) Summary of the study population.(B&C) Multi-trajectories of BMI and WC in CHNS cohort (1991–2015) among males (B) and females (C). The solid lines represent average estimated BMI and WC over time. The dots represent the actual data, where we weighted each individual’s responses based on posterior probabilities of group membership. (D) Associations between multi-trajectories and dyslipidemia based on binomial logistic regression model. Both models were adjusted for age, location (urban/rural), geographical area (province), education level, smoking, drinking, household income, physical activity, and dietary energy intake.

